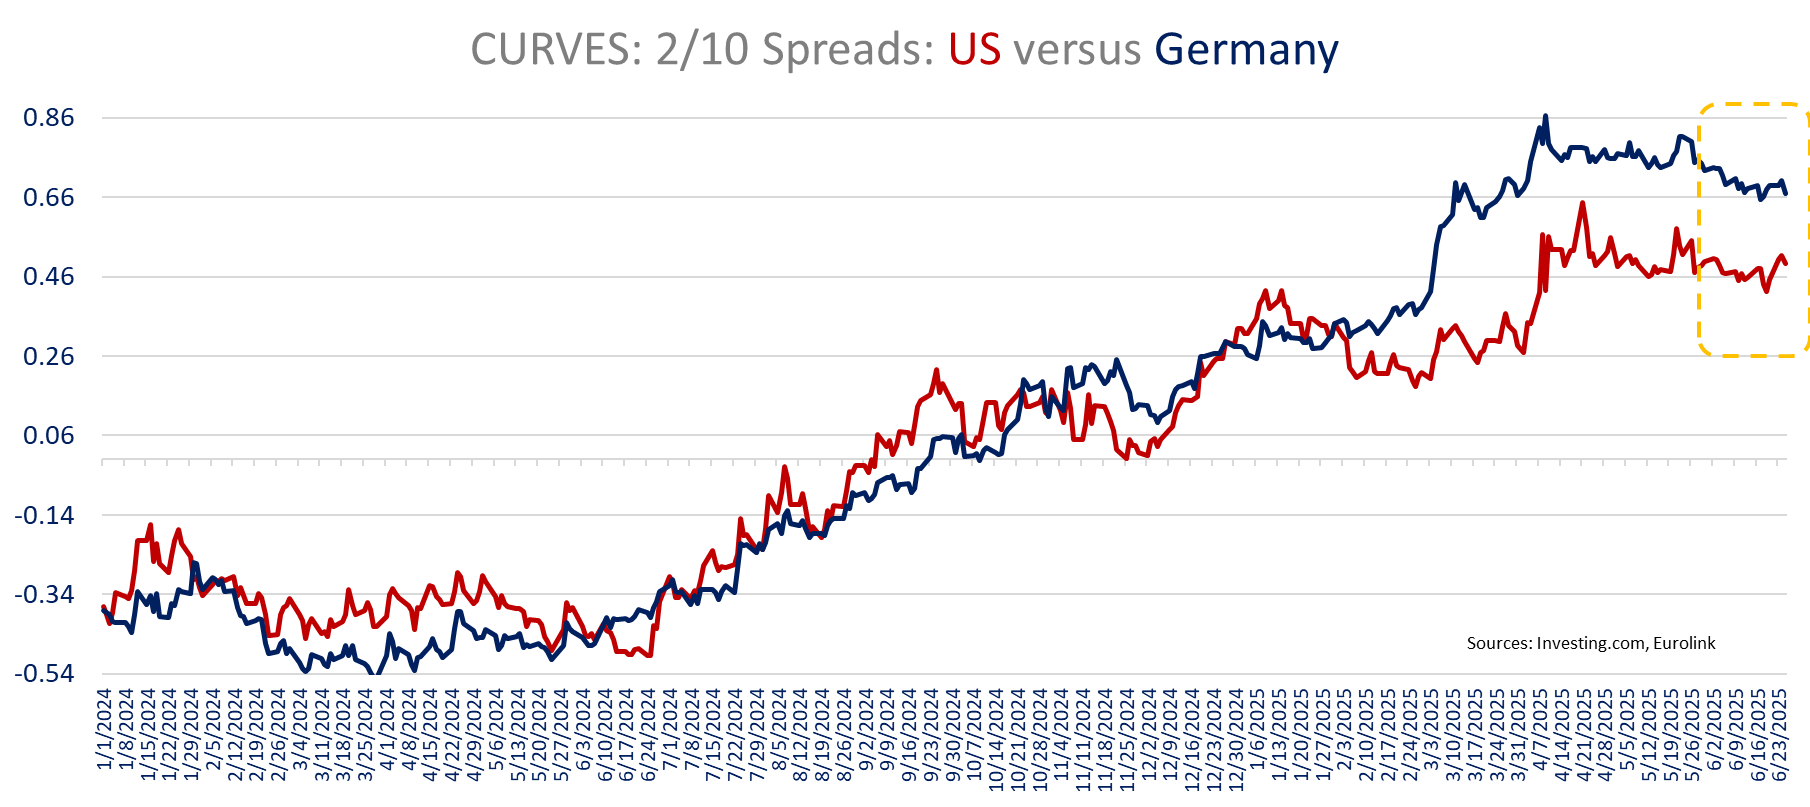
With Powell leaving the door open for a July cut, US yields were down initially but after falling below 4.30% we are back at that level. Oil prices are up after yesterday’s sharp decline and the $ up slightly this morning (98.1 DXY). European yields are up with Bund 10yr at 2.56% and 30 yr at 4.20%: unlike the US Treasury or the $, the “12-day war” did show that markets still saw bund as a haven. Eurozone Sovereign bond spreads increased with the geopolitical risk and deflated with the ceasefire agreement. Bund yields are also up on larger German spending and borrowing ahead. The short escalation and de-escalation in the Iran- Israël war also highlighted the fact that Bitcoin short term moves are more driven by risk/ liquidity than storage of value.
The truce seems to hold but with uncertainty on where the Iranian nuclear program stands concerns are still lingering. Tariffs are also soon back in the forefront just week away from the July 9 deadline, with FedEx also as a reminder.
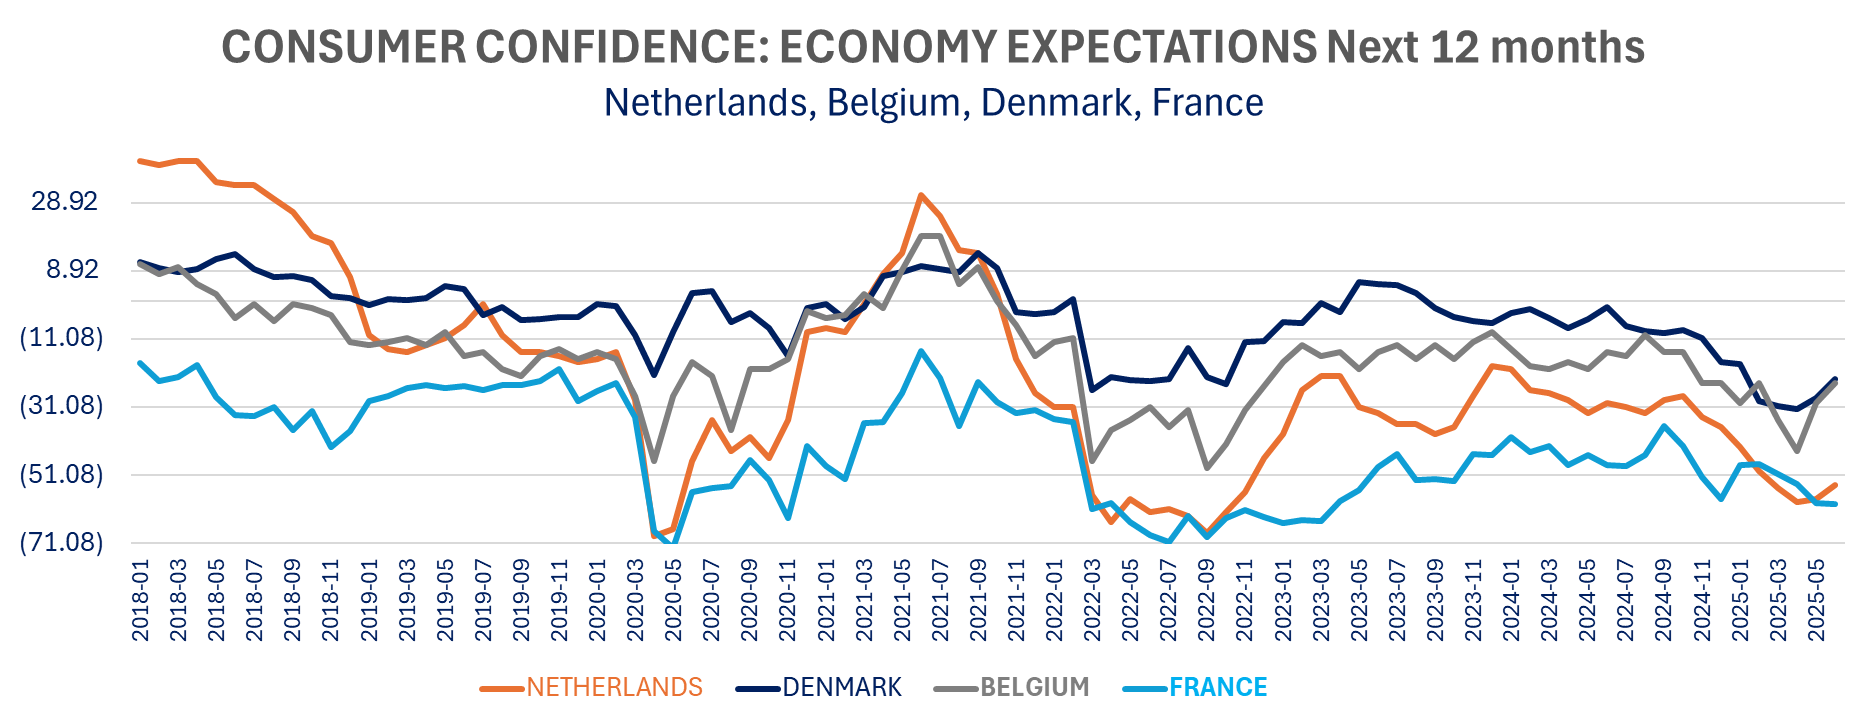
The ECB is expected to stay put in July. On the positive side, the consumer confidence data show limited inflation concerns. Consumers Price expectations is down in France as it was in the Netherlands (and Denmark outside the Eurozone). Belgium was the outlier with a bounce in price expectations.
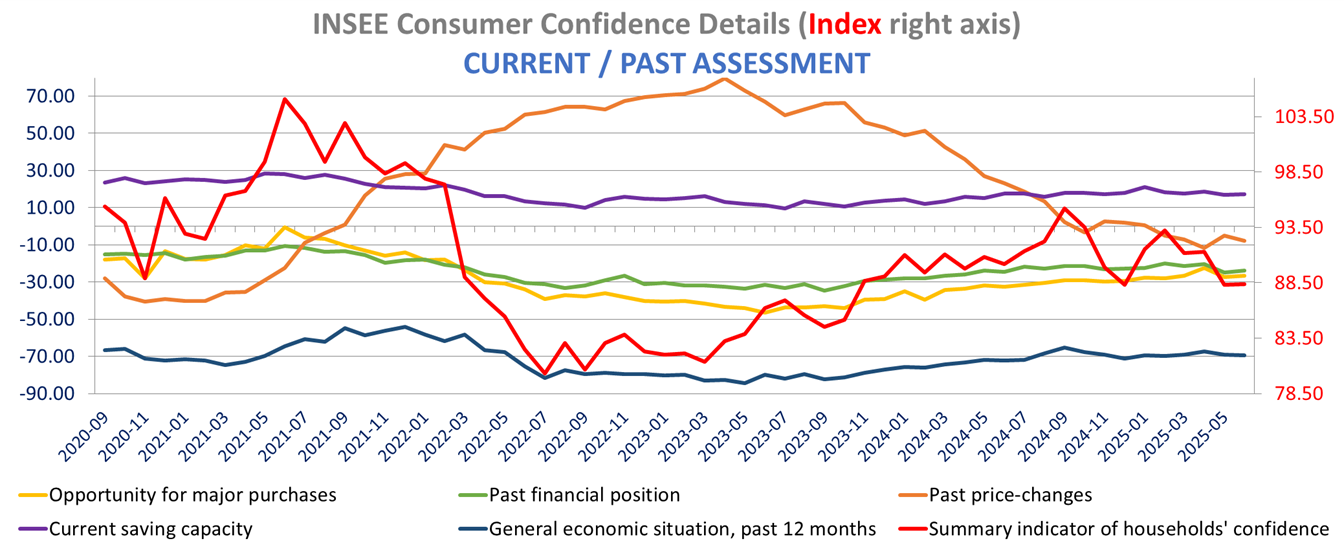
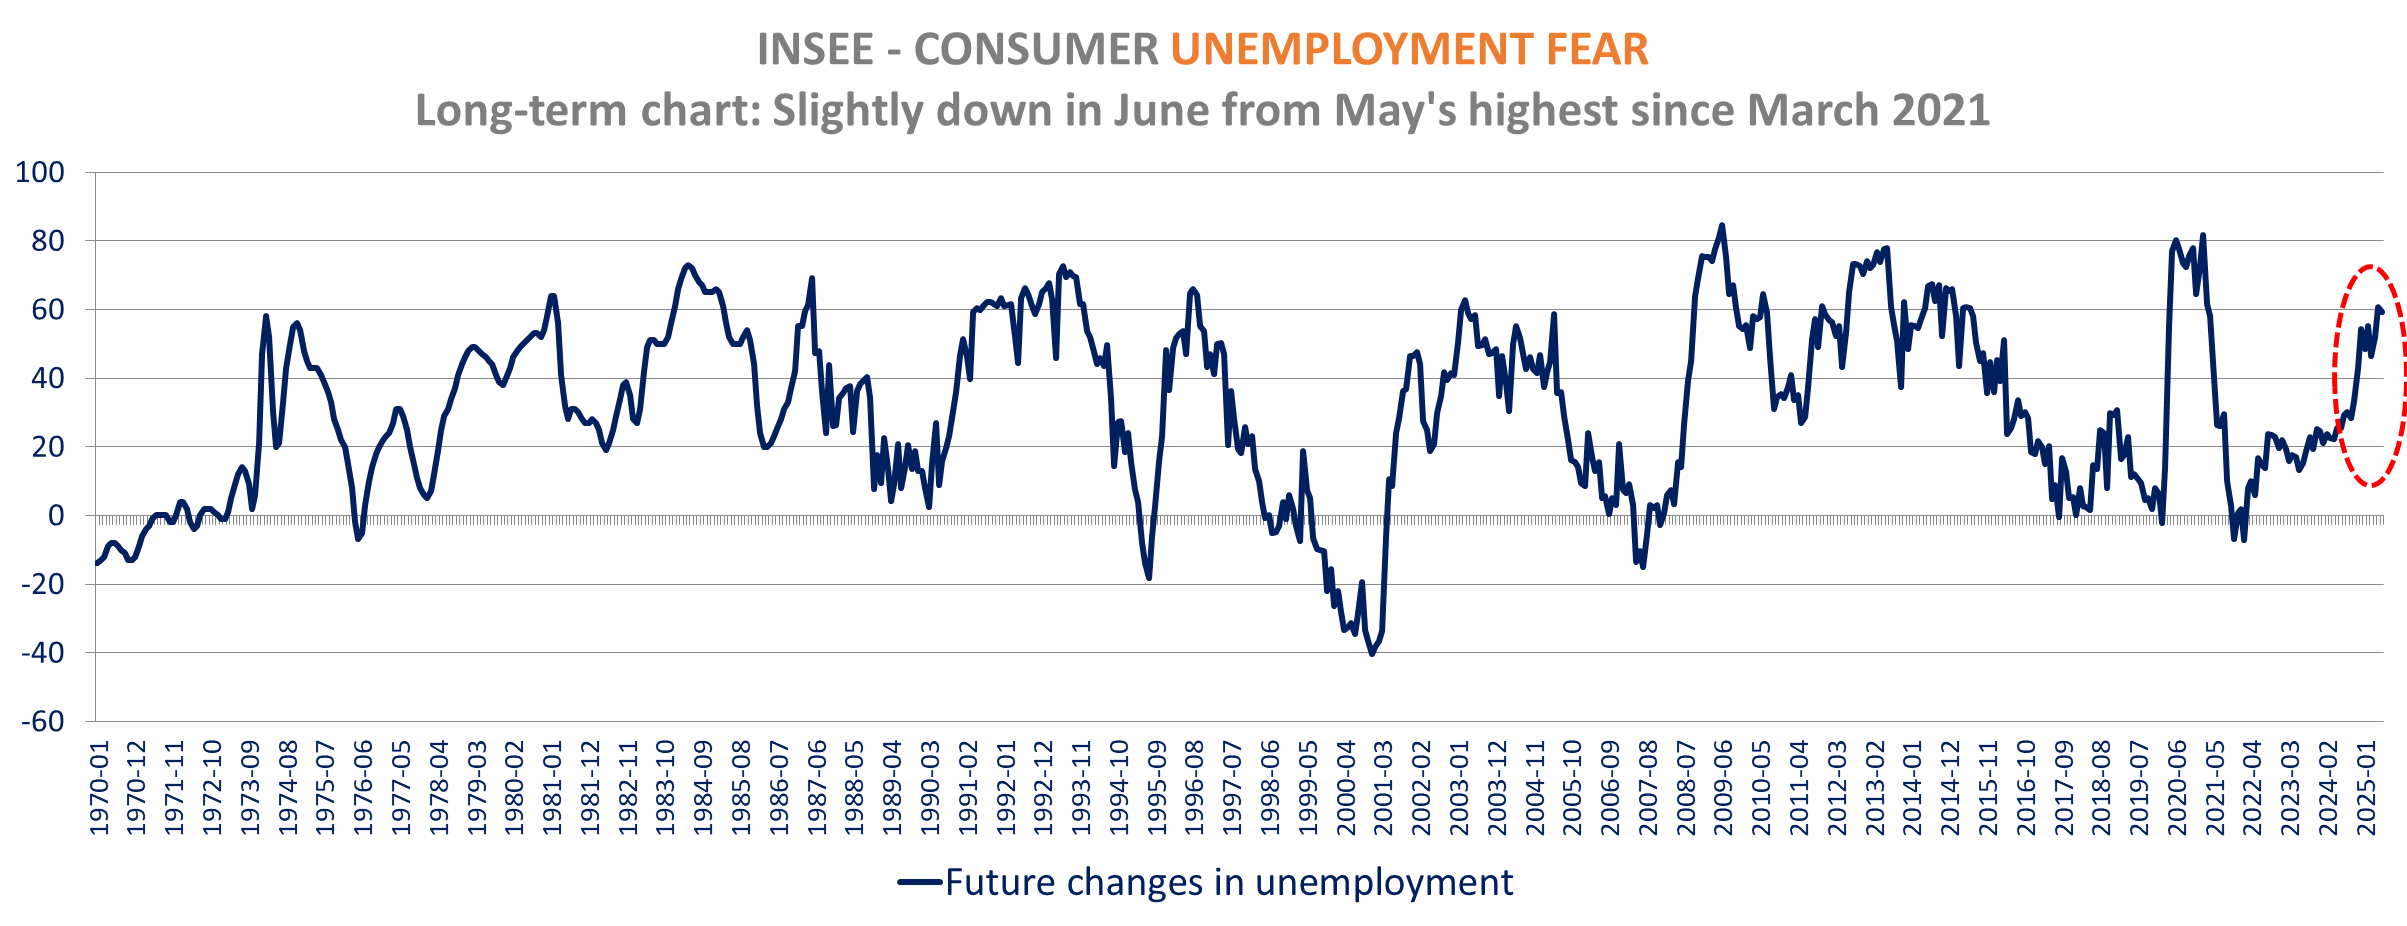
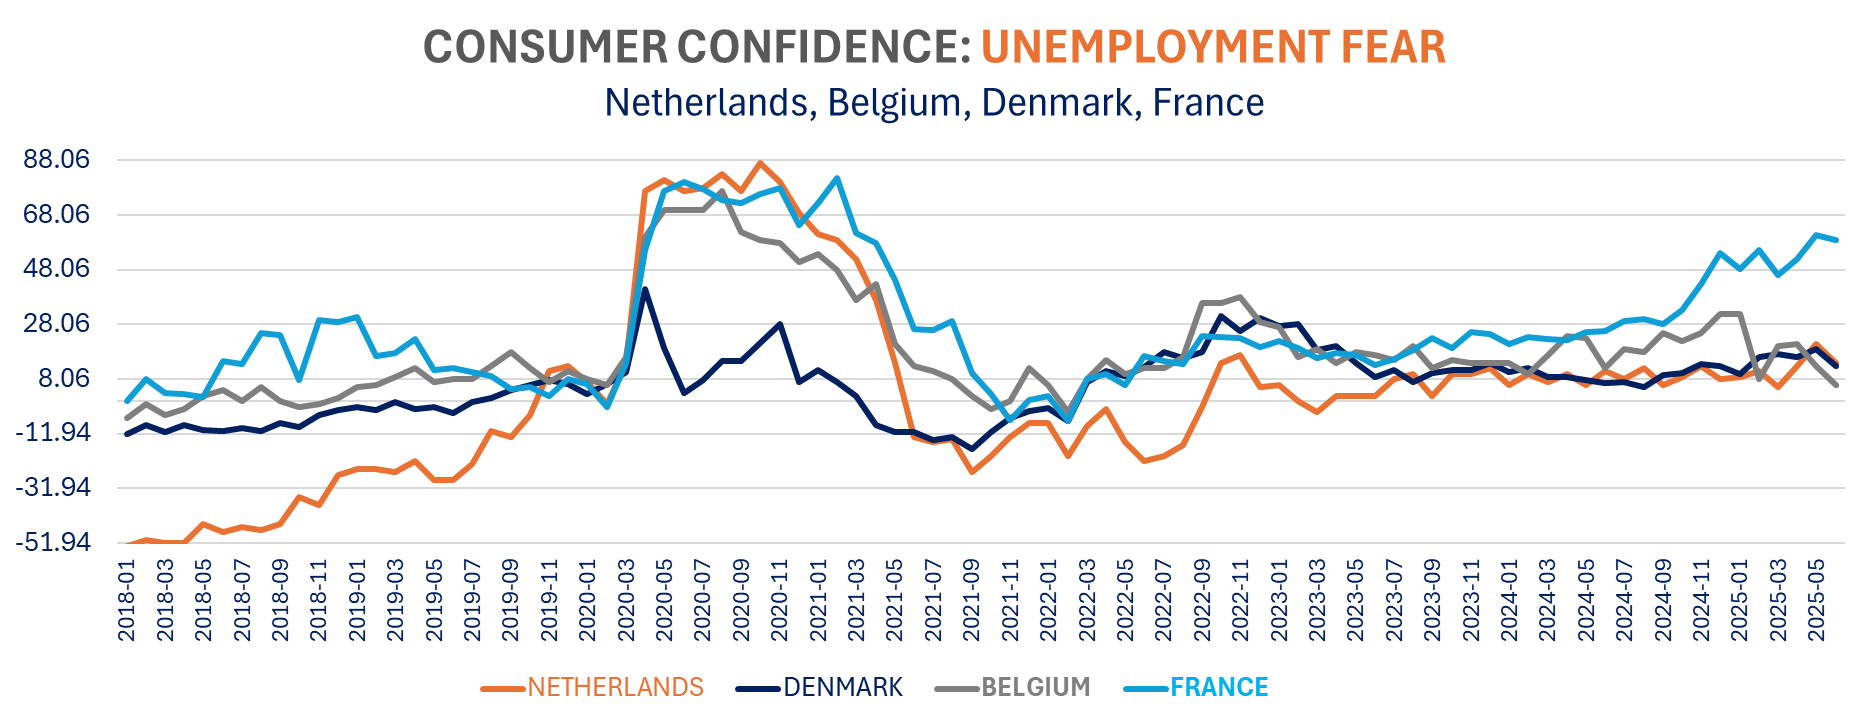
The French consumer confidence continues to paint a very gloomy picture. Unlike for its peer (Belgium, Netherlands, Denmark), Households are a tad more negative on the economic outlook. The INSEE Consumer confidence is unchanged in June (88.4 vs 88.3) far below the average of 100. The unemployment fear eased only marginally (59.1 vs 60.8) after rising to the highest since March 2021 in May. Large purchases intention are as negative in June as in May and French households’ savings intentions are higher. The unemployment fear was also a common theme with in the Belgian, Dutch and Denmark consumer confidence.
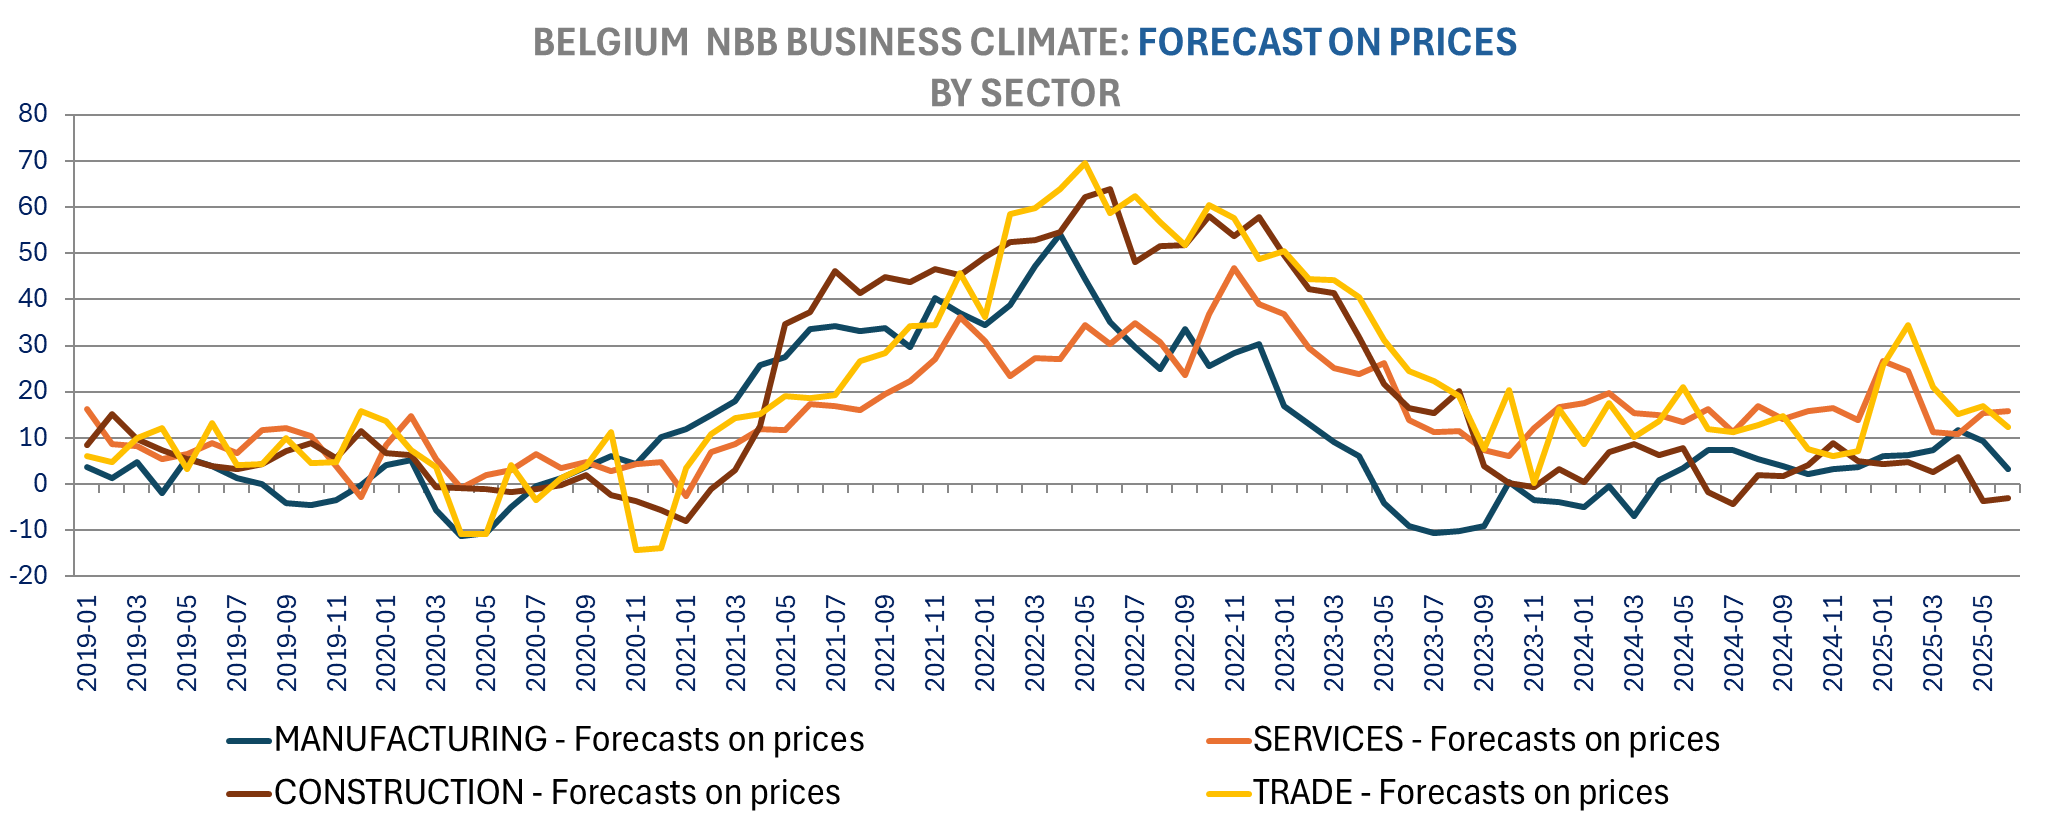
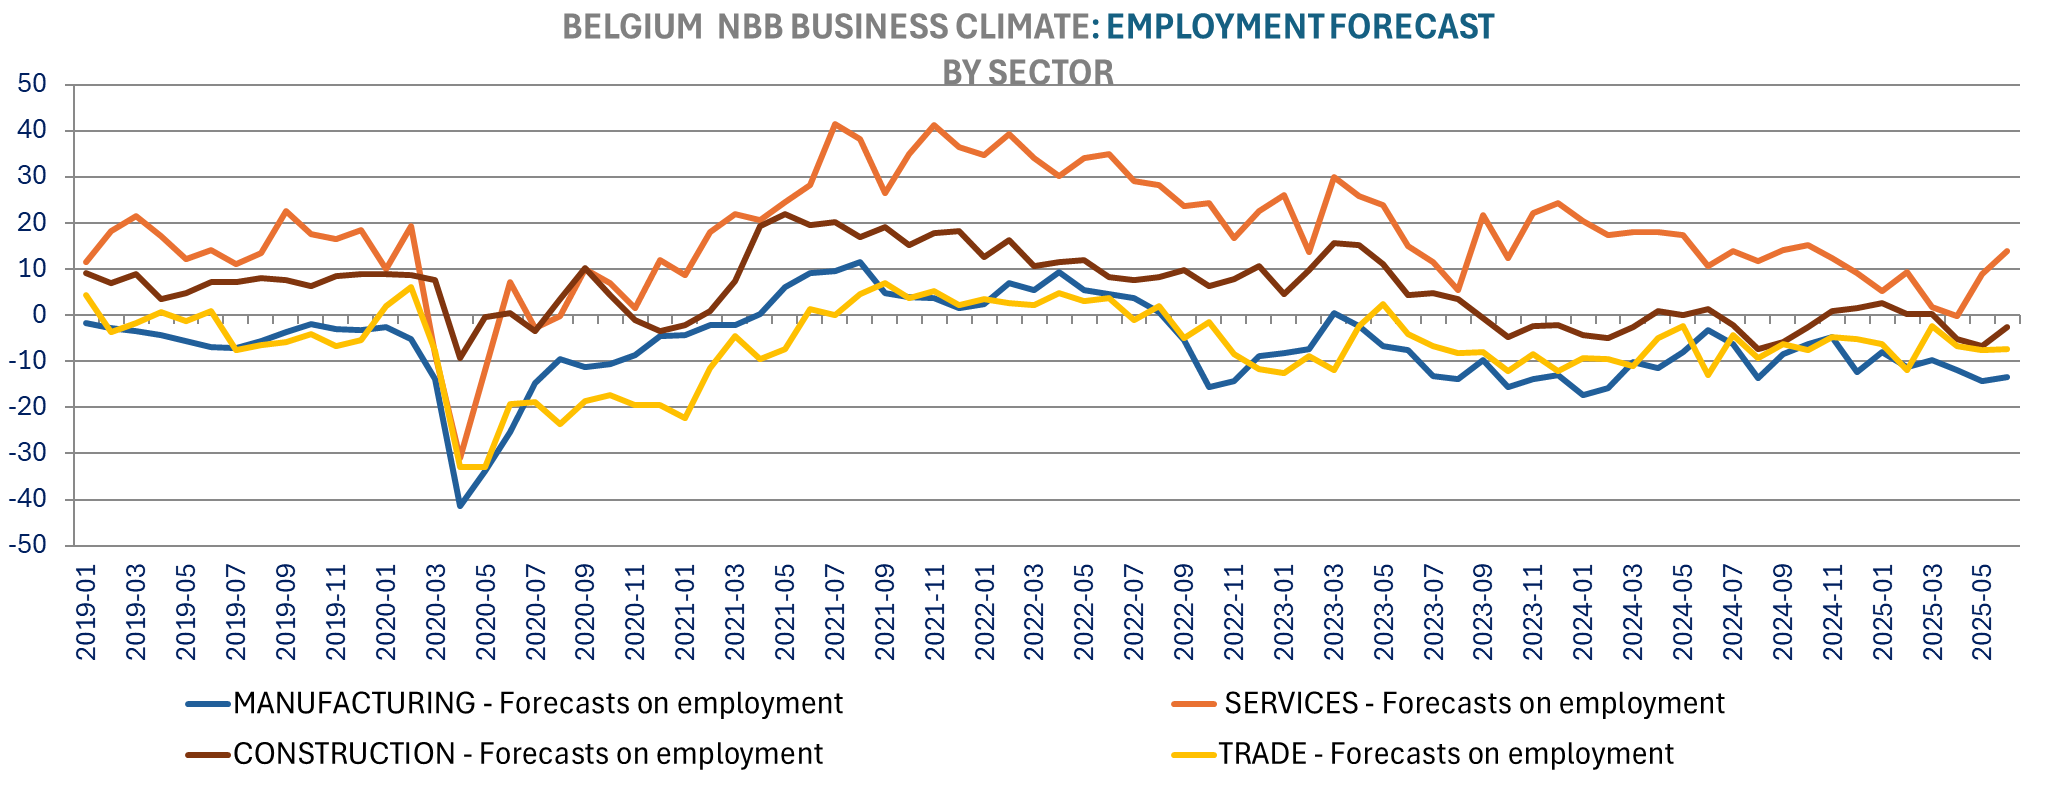
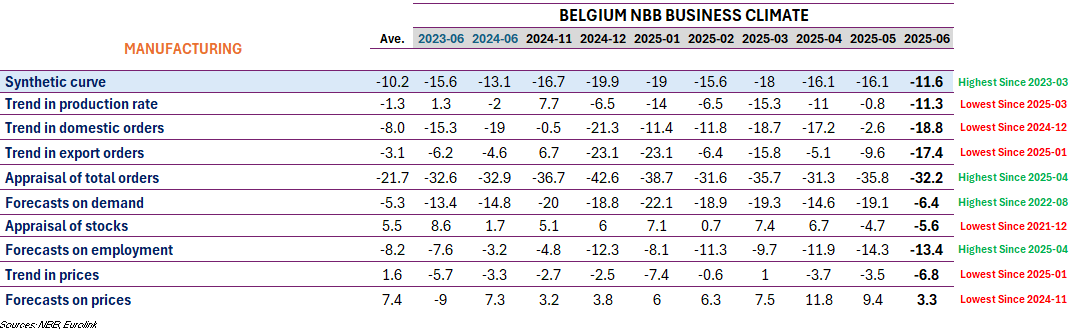
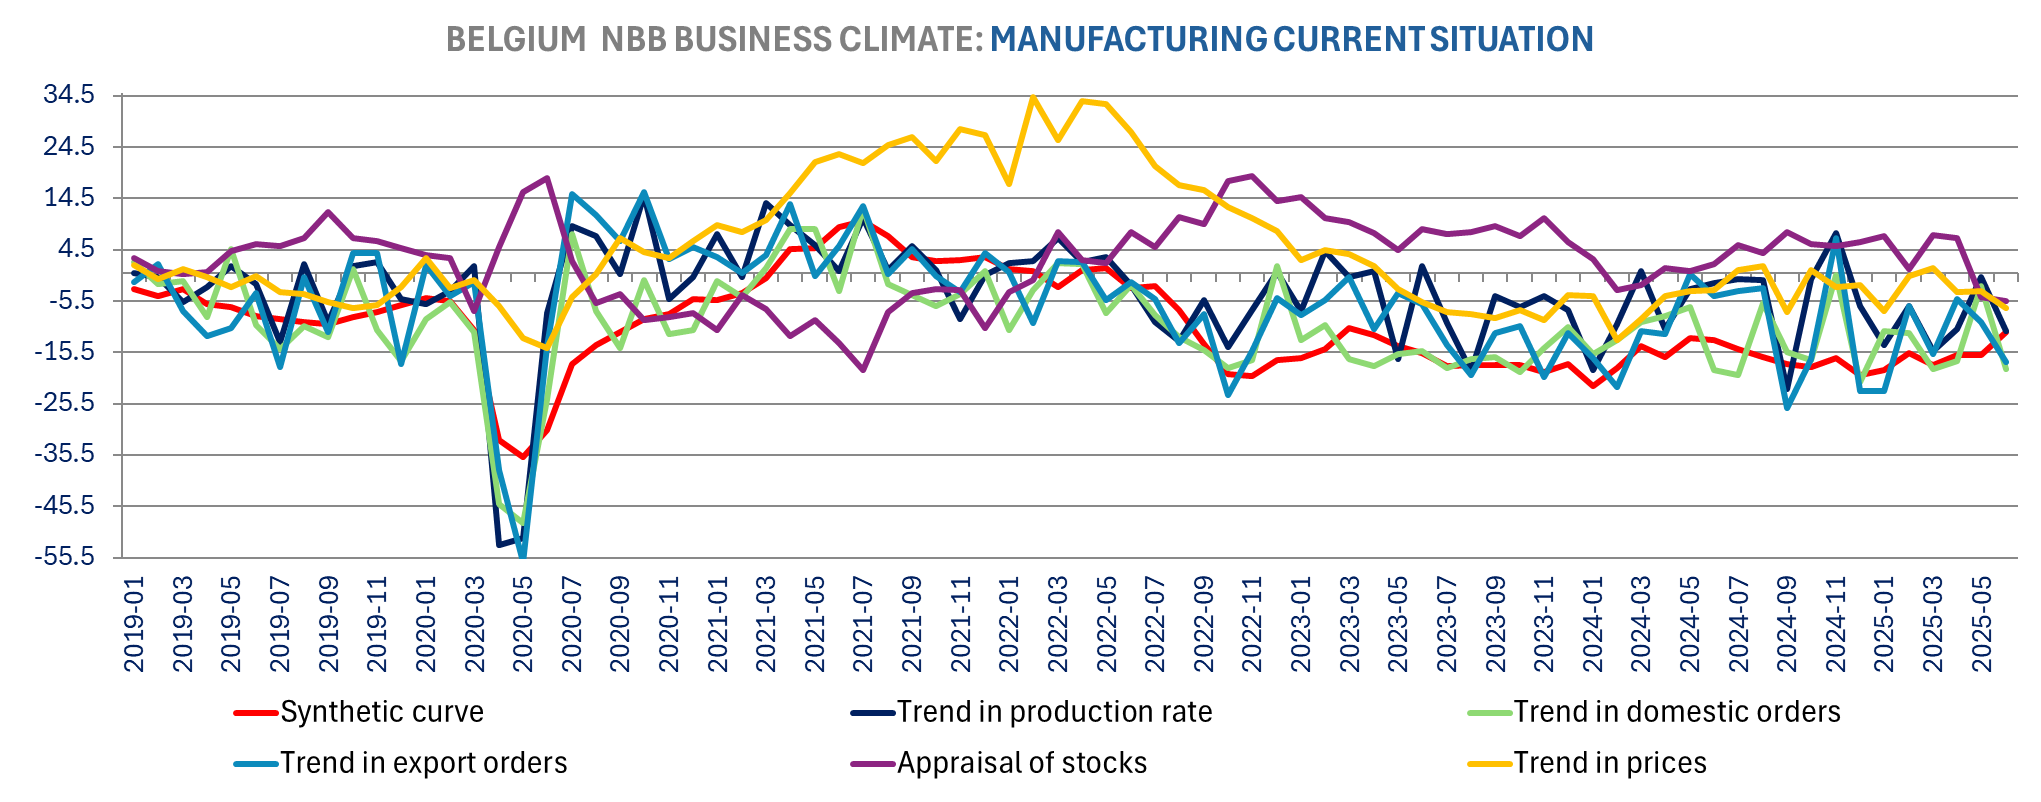
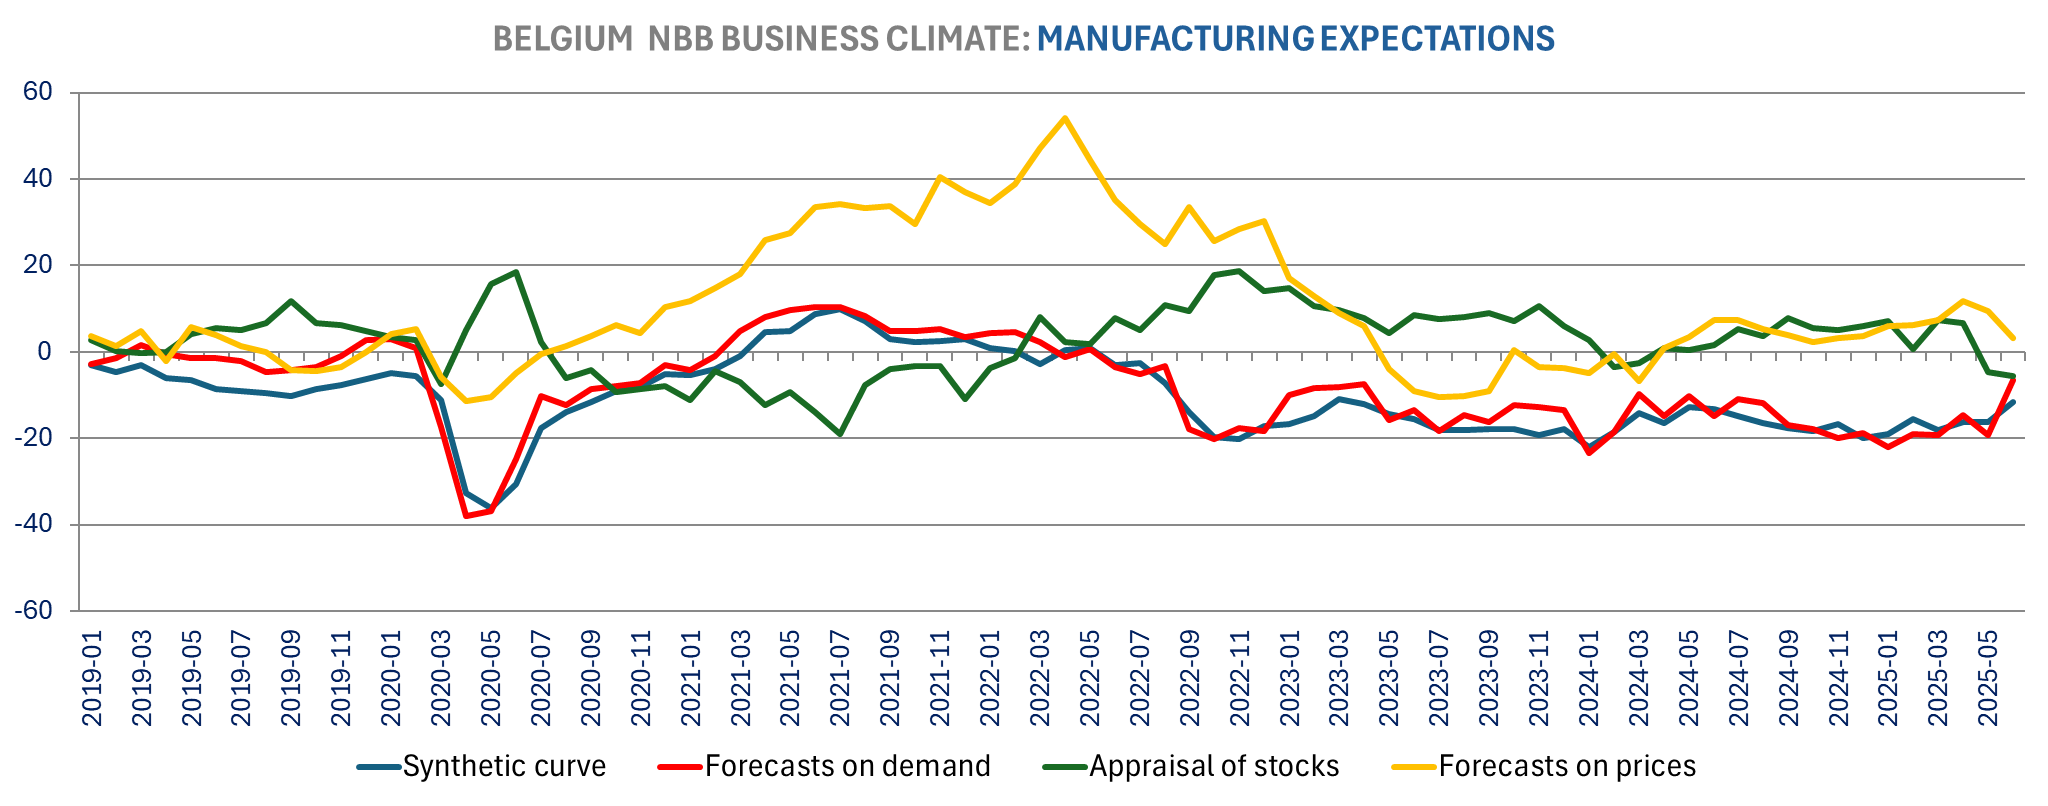
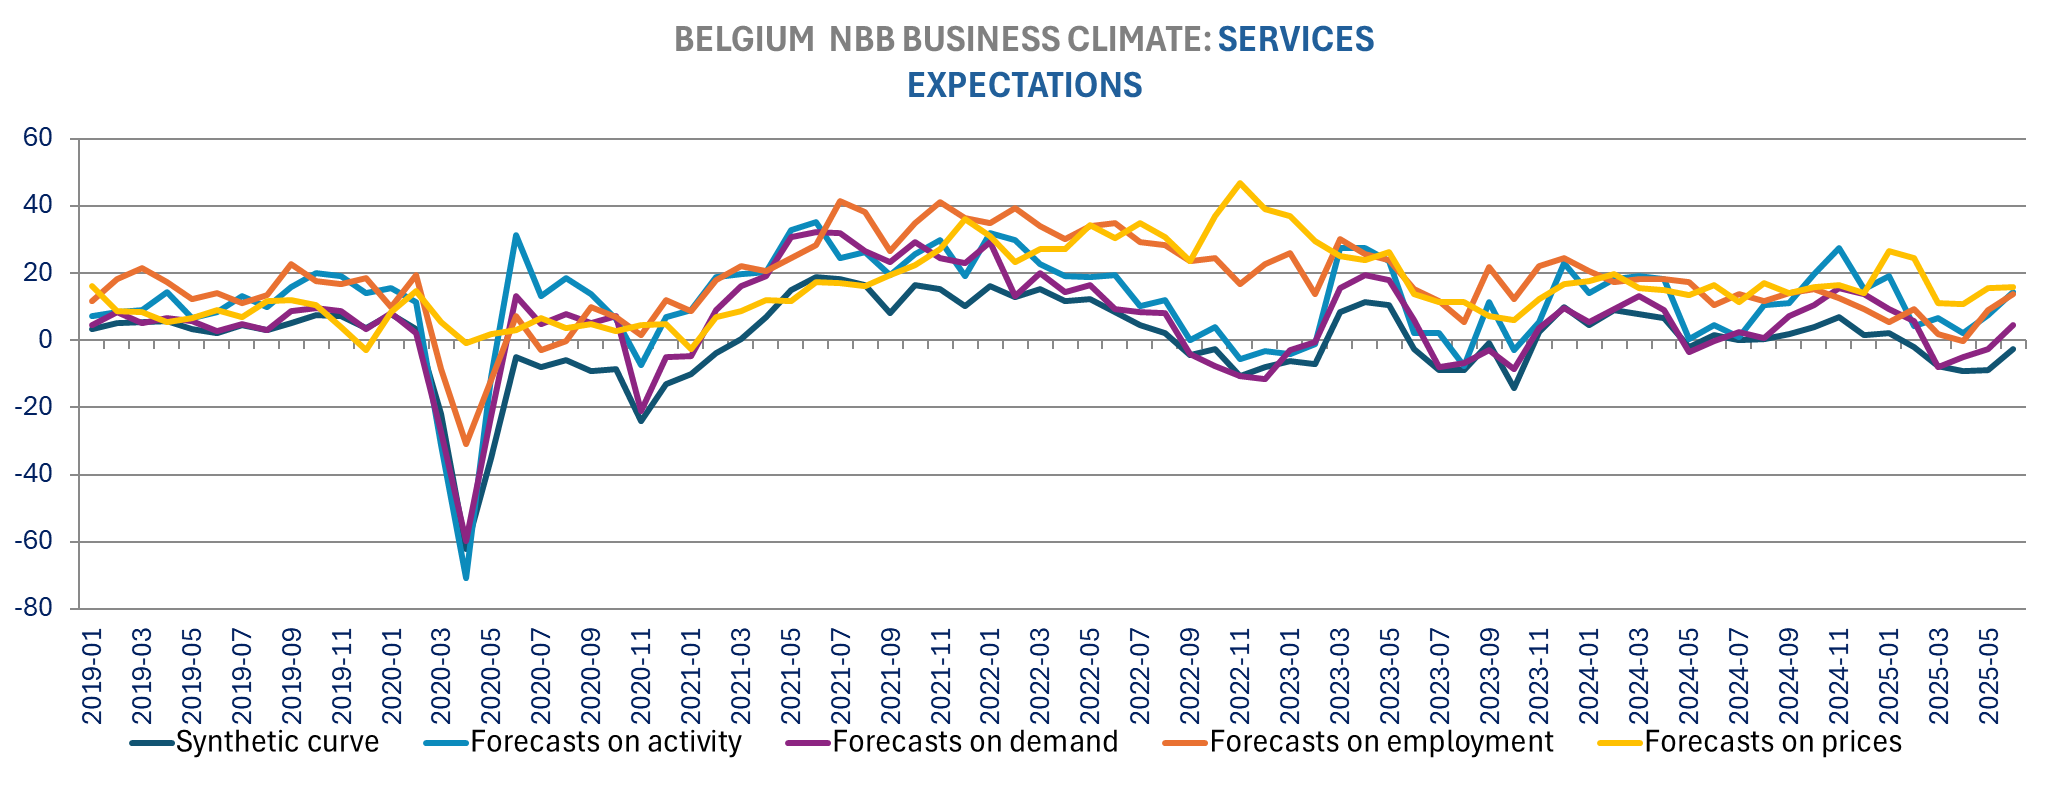
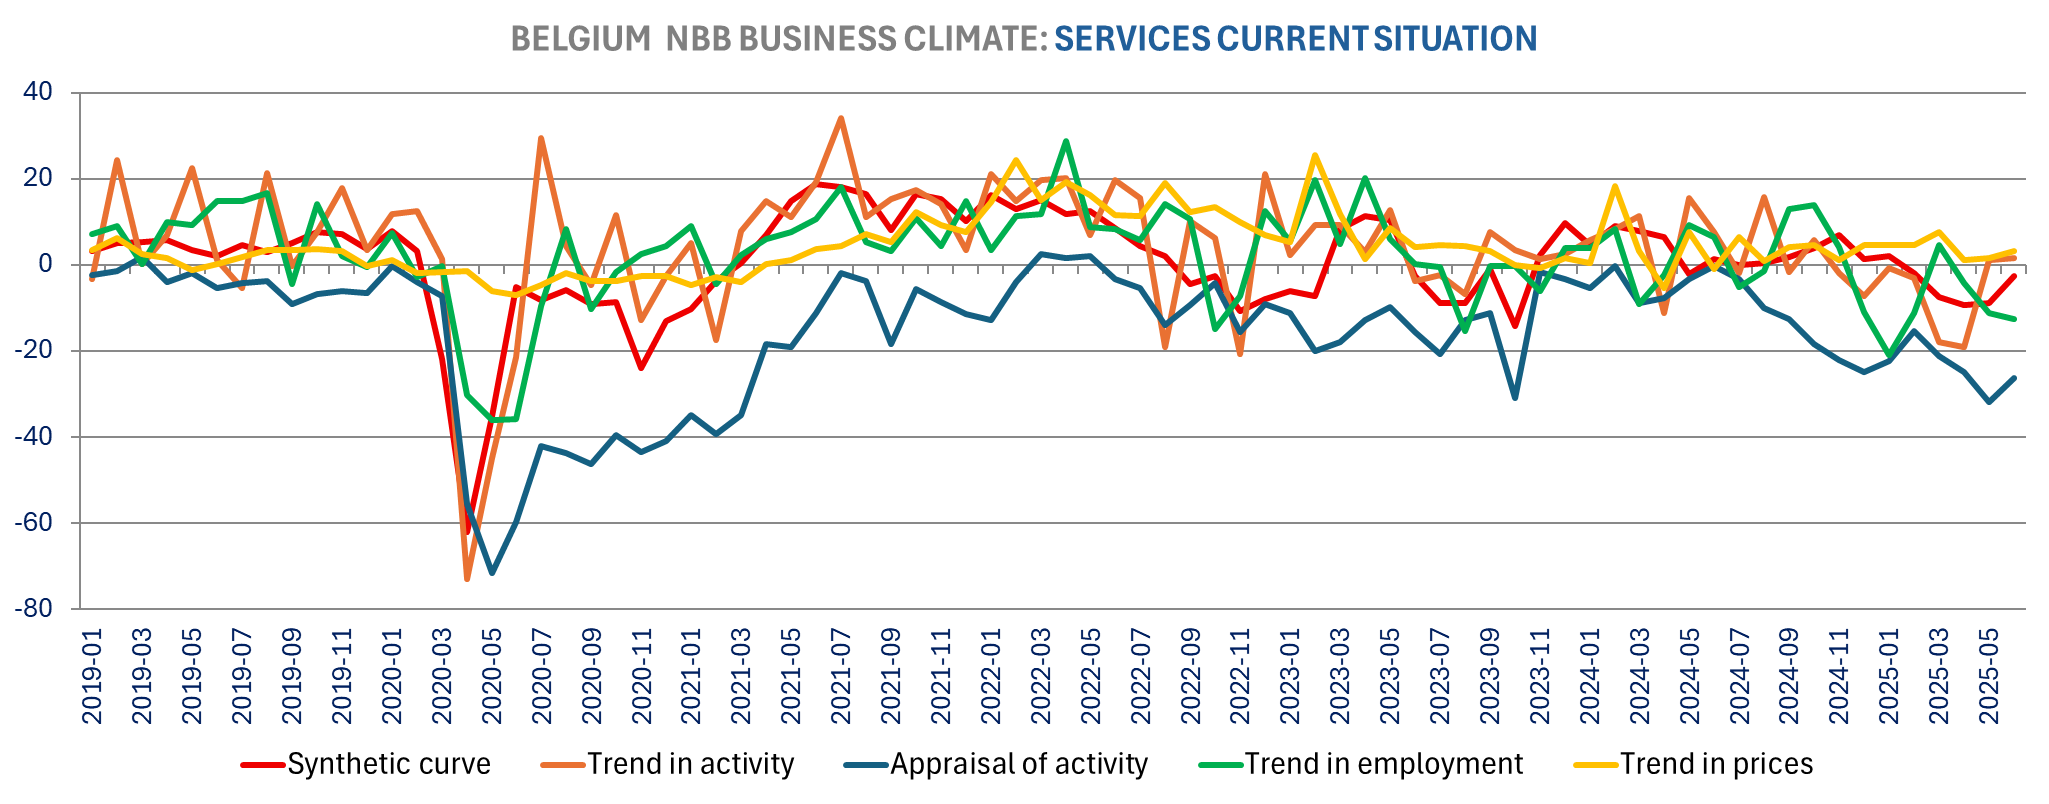
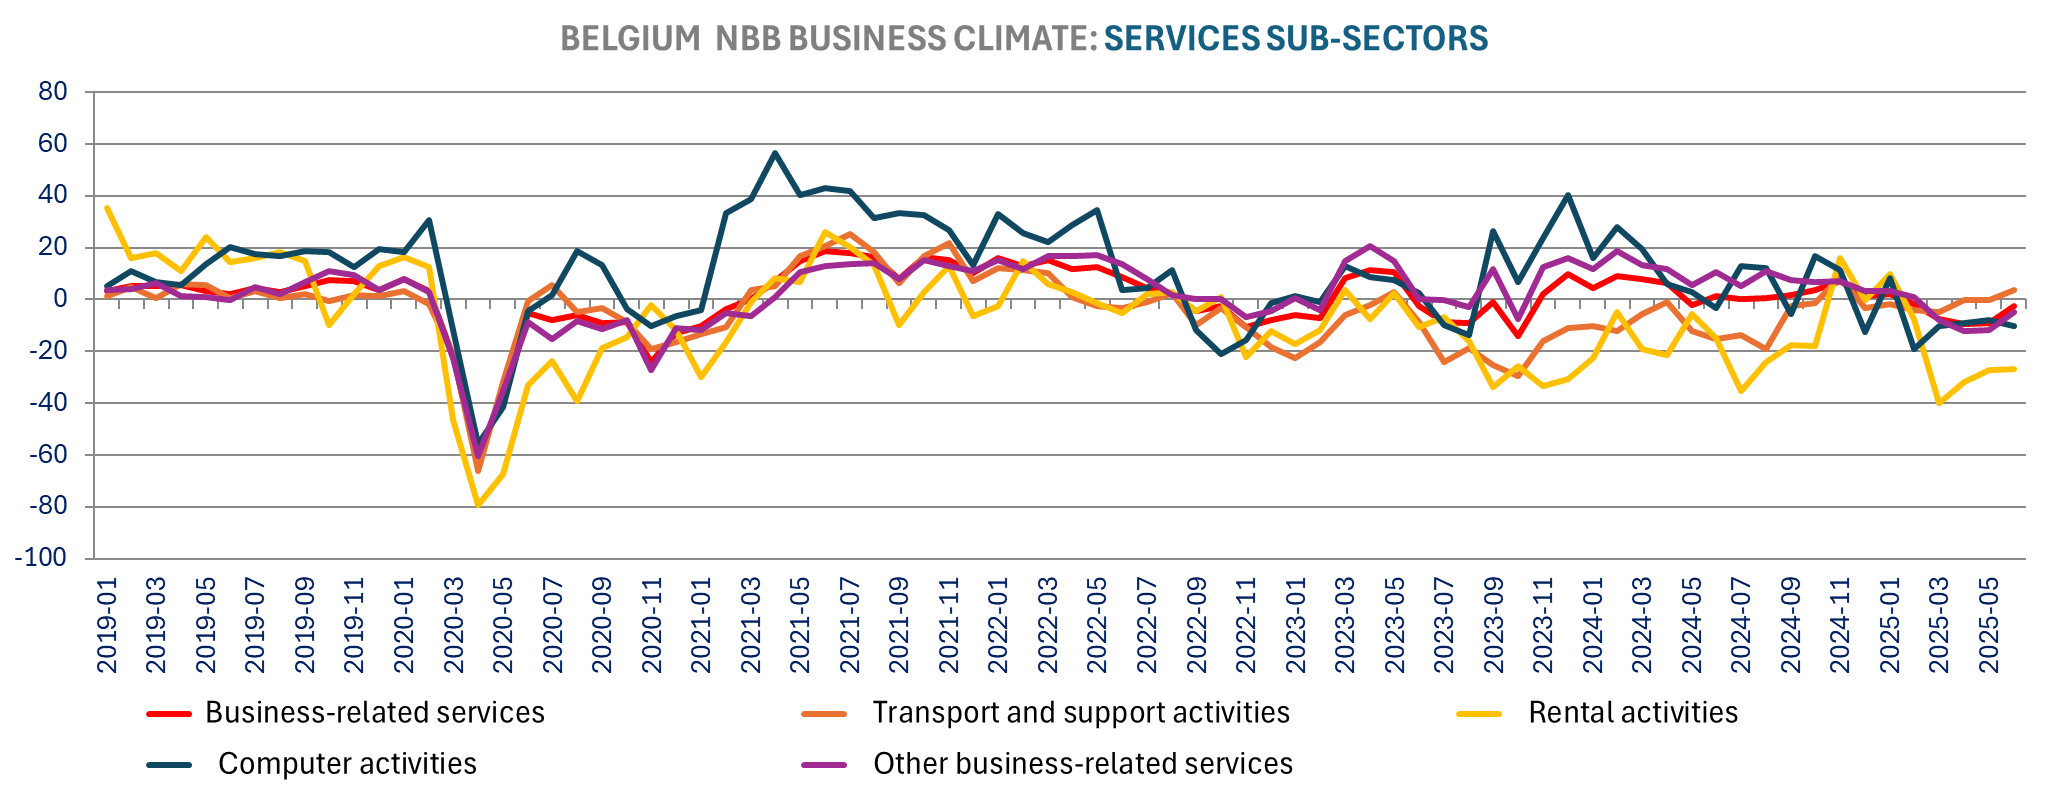
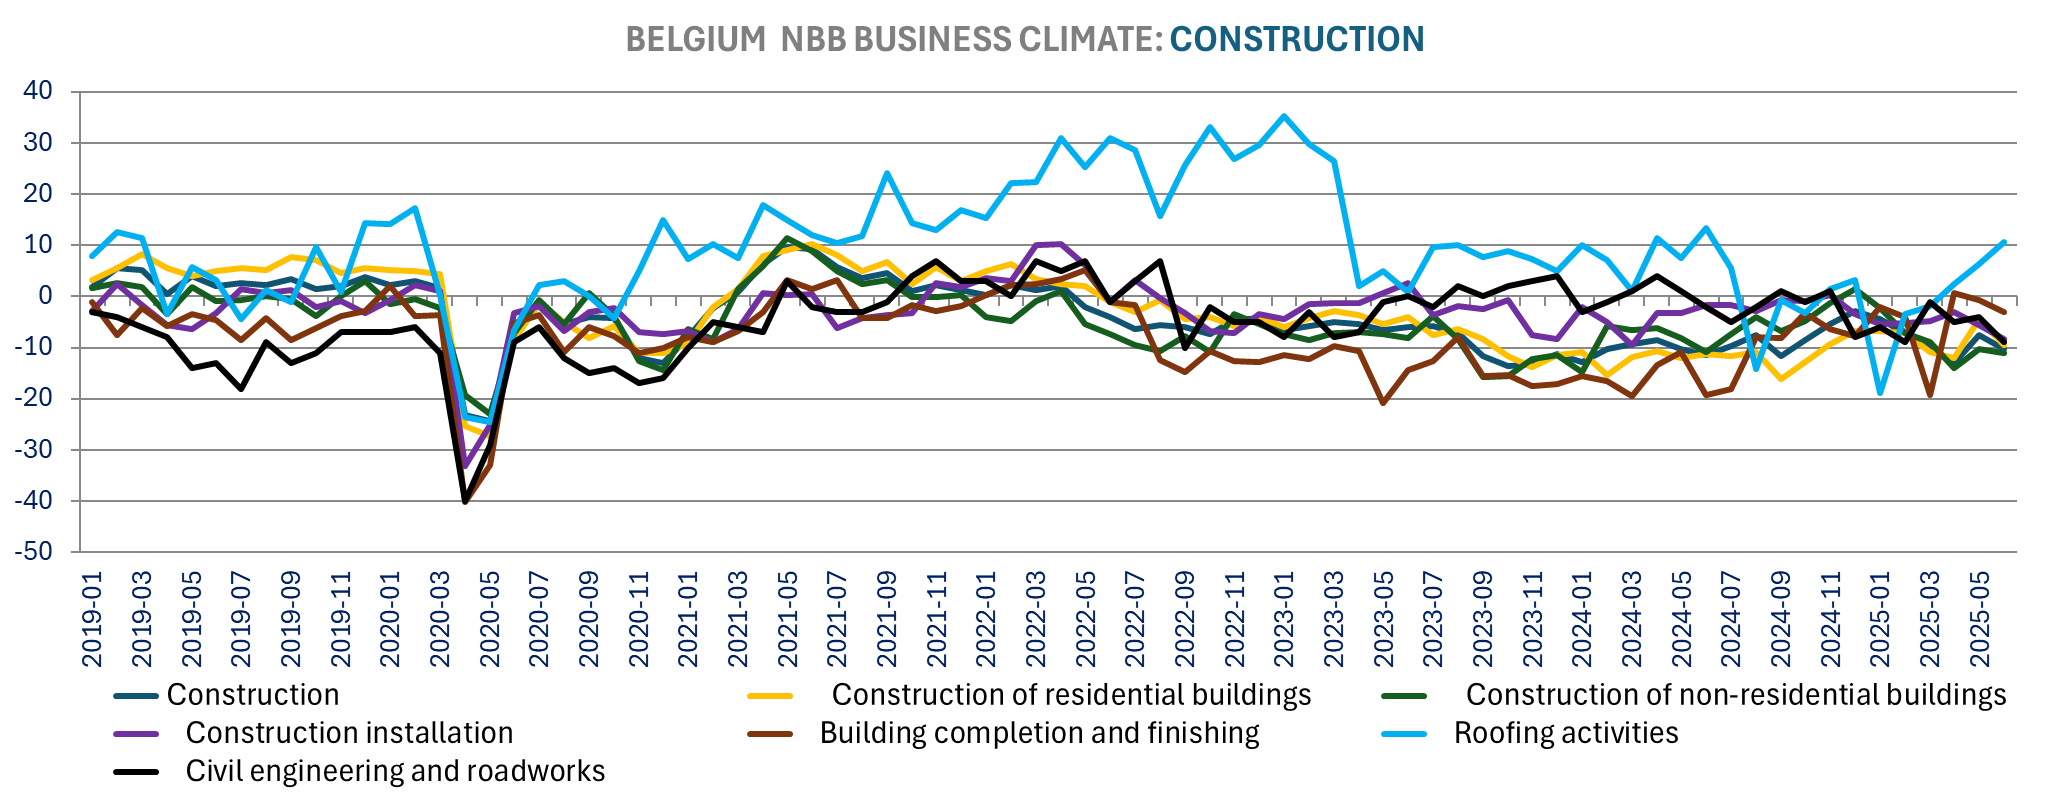
The Belgium NBB business confidence continue to show resilience in the labor market as well, with improvement in employment expectations across all four sectors (manufacturing, services, trade, and construction), improving the most for services (13.9 vs 9, best since October) and construction (-2.5 vs -6.6). The Belgium NBB business confidence increased in June to the best in level in more than two years (May 2023) at -10.1 vs -13.5 in May. Manufacturing continues to recover with strong Jump in climate to -11.6 vs -16.1, up for the 3rd consecutive month and to the highest level since March 2023. Services sentiment also bounced back significantly in June to -2.6 from -9 in May to a 4-month high. Price expectations are down for manufacturing and trade, but up for construction and services. Overall, there is limited price pressure in manufacturing, however, as we saw with the Flash PMI we have a slight acceleration in services.
France continues to struggle relative to peers, It was already clear with the Flash PMI, but the weaker consumer confidence than for the other countries which already reported (Germany tomorrow). The confidence of French consumers is comparatively lower than that of their counterparts, with very weak (and not improving) view on the economic outlook, and higher unemployment fear: (see relative charts). The May car registrations also put France far below peers. Politics remain difficult with another deadlock negotiations on pensions. We continue to see the French/German spread widening again.
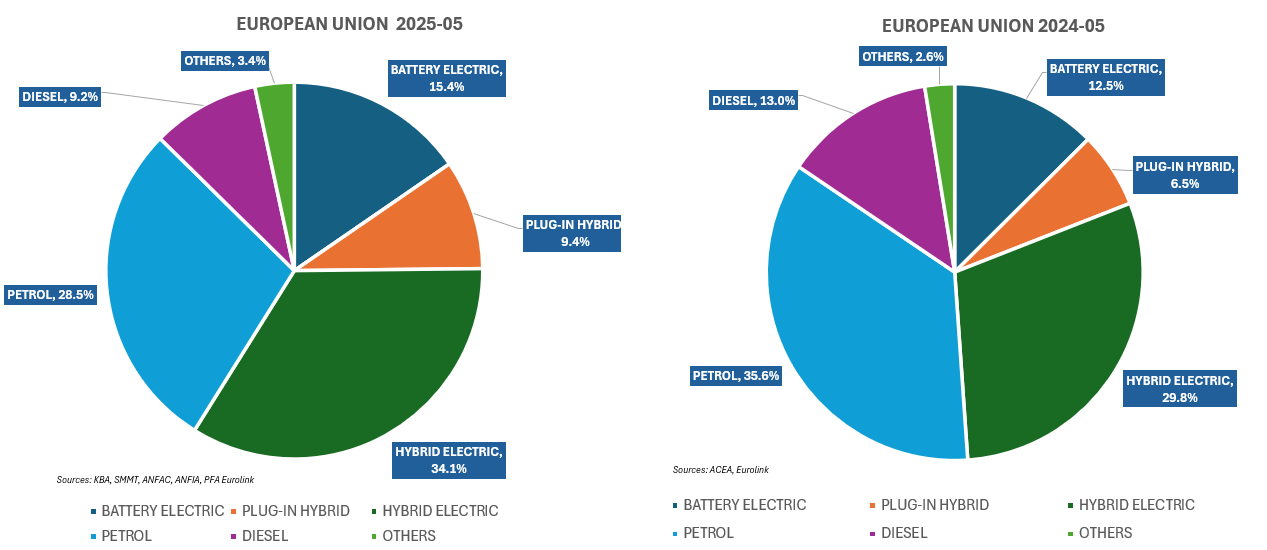
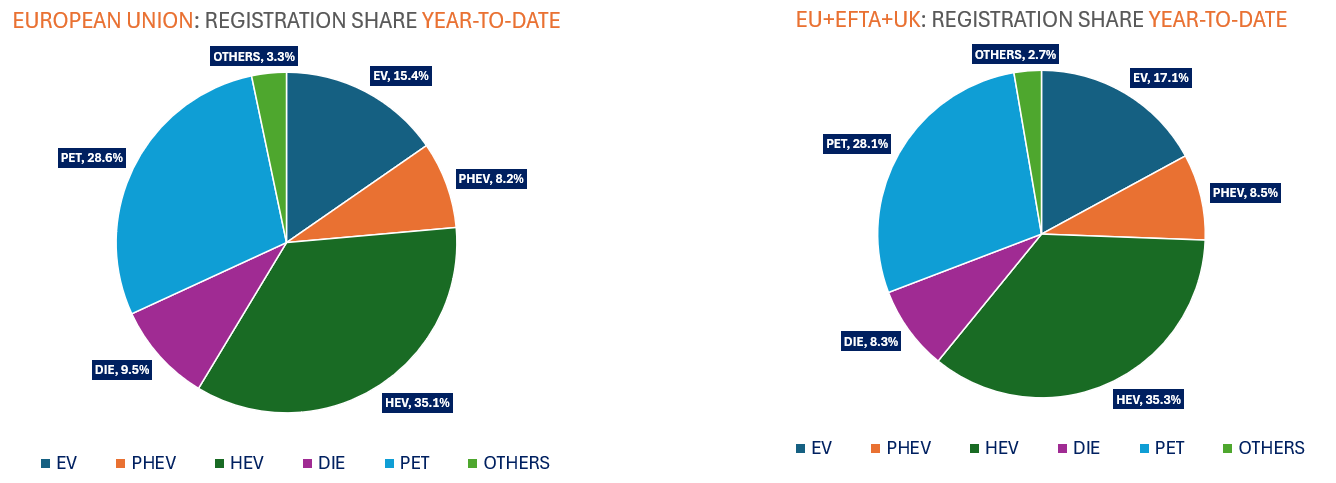
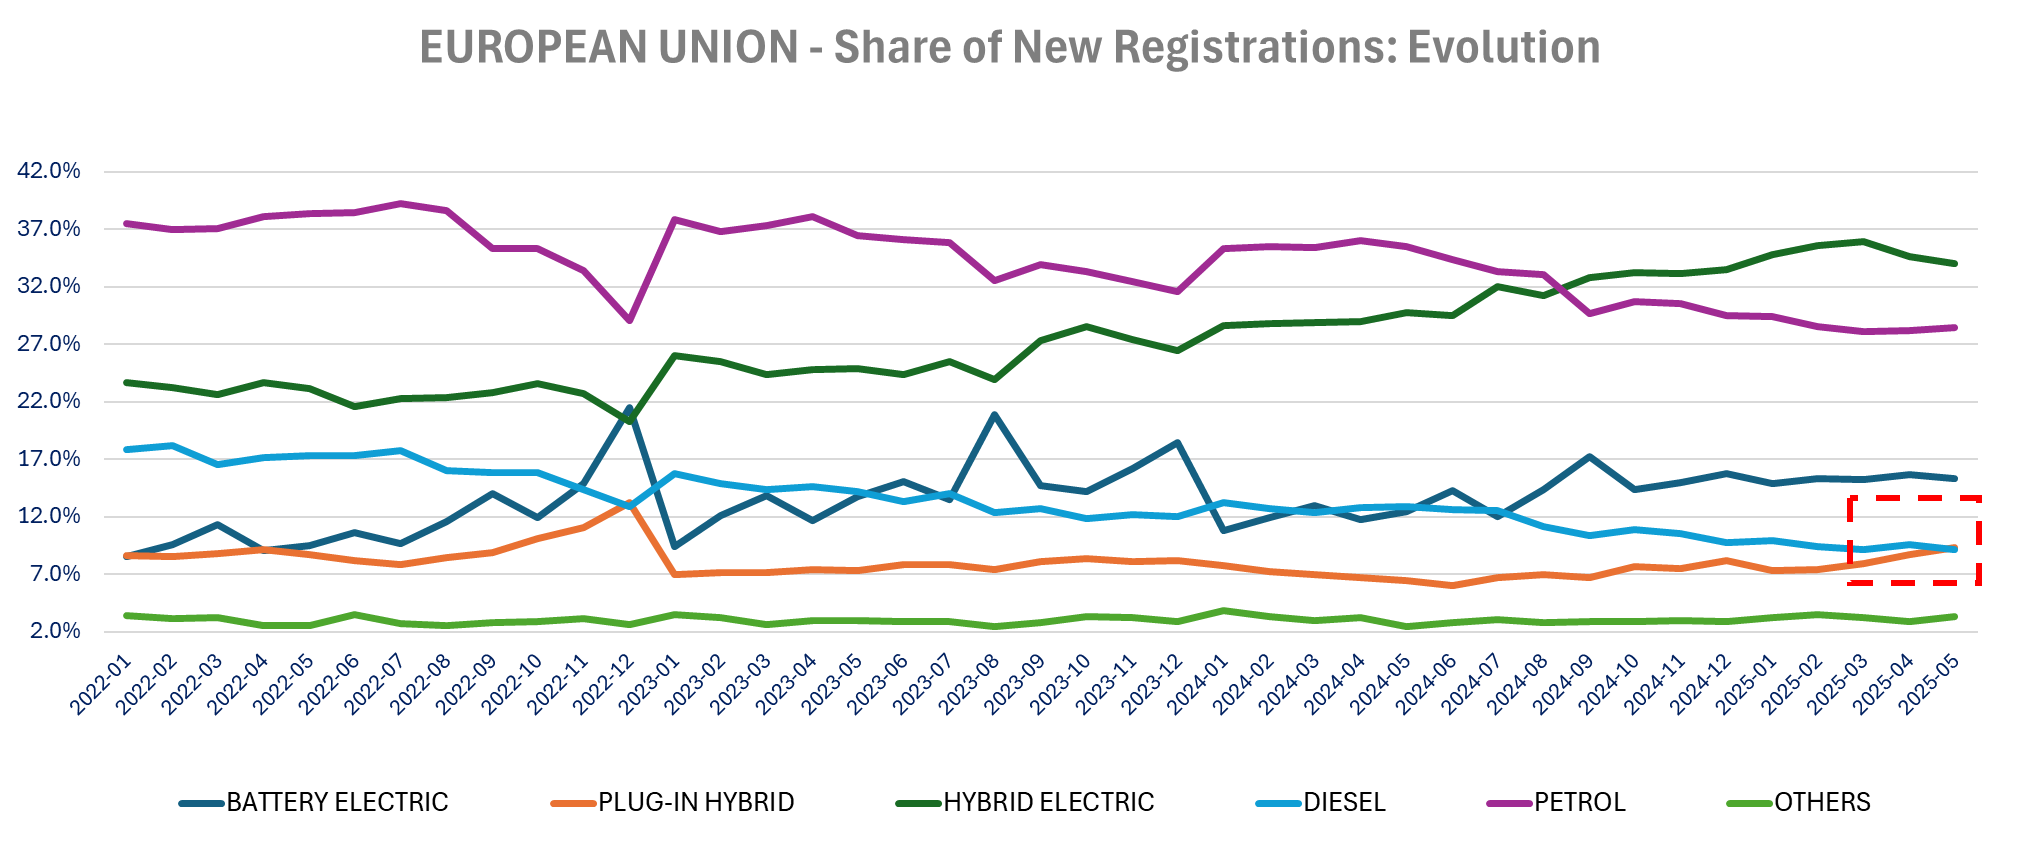
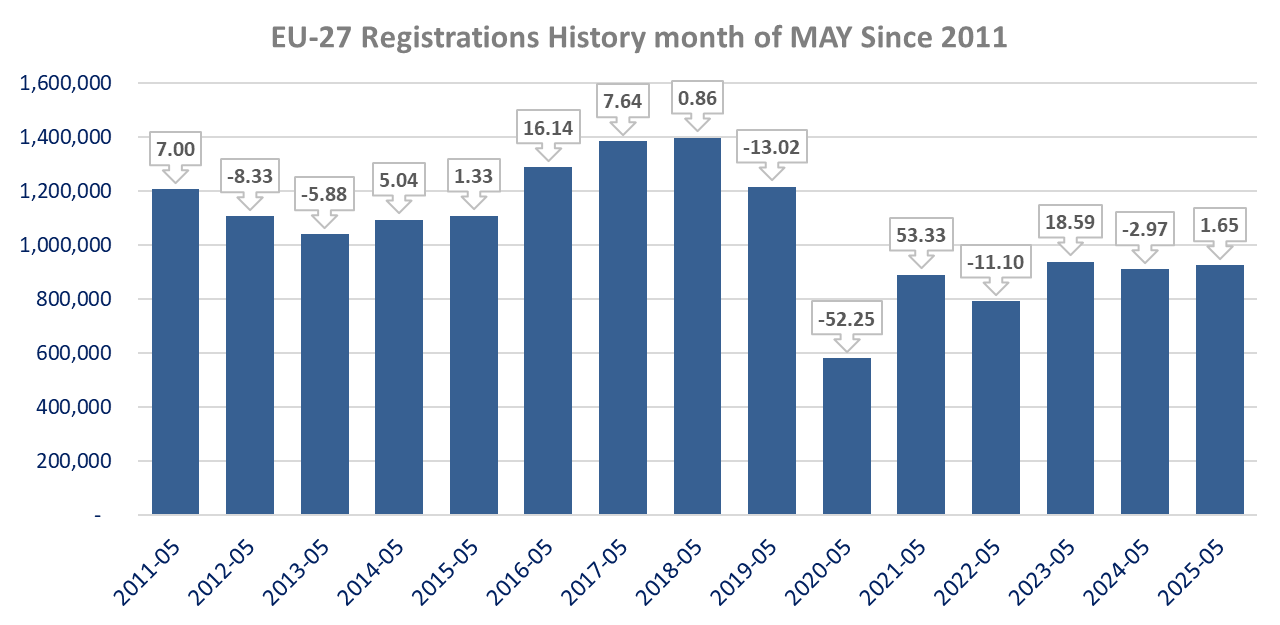
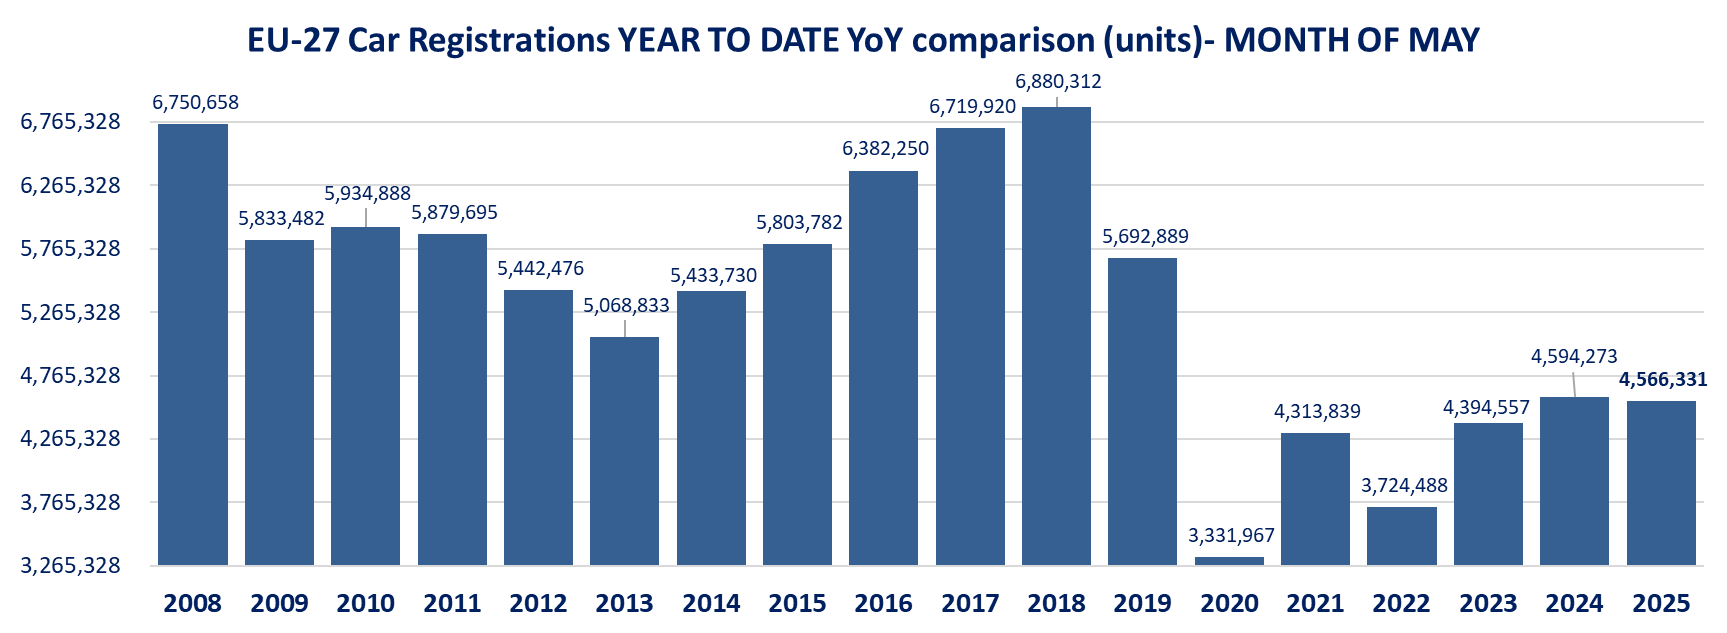
The European May car registrations, shows a slight improvement up 1.6% year-over-year in the EU (+1.9% yoy in the EU+EFTA+UK), but still far below the 10yr average. Year to Date sales registrations are down -0.6% yoy in the EU improving from -1.2% yoy ytd in April and now up +0.1% yoy in the EU+EFTA+UK. Within the Eurozone Spain (+18.6%yoy), Austria (+22.7%), Greece (+13.9%) , Lithuania (+43.8%) and Latvia (+27.8%) posted the strongest growth, while France (-12.3% yoy), Belgium (-11.7%), Finland (-12%) an Estonia (-25.9%) were the weakest on a year-over-year basis. On a year-to-date basis for the EU, EV are up 26.1% yoy (15.4% share), HEV is up +19.7% (35.1% share), PHEV +15.2% yoy (share of 8.4%). Ytd diesel registrations are down -26.6%, gasoline -20.2% yoy with respective share of 9.5% (down -3.4pts yoy) and 28.6% (down 7points!) – see detailed tables Year-to-Date.
On the companies’ front: BBVA received the authorization from the Spanish government for its acquisition of Banco de Sabadell. However, BBVA said it assesses the conditions attached to the agreement notably the request that BBVA and Sabadell remain separate autonomous entities for 3 years. Babcock FY25 operating profit rose by 17% amid 11% higher organic revenue growth, driven by strong growth in Nuclear and Marine. Babcock said it will reach in FY26 its medium term 8% operating margin goal and upgraded the new the mid-term goal to 9%. The defense company also announced a £200m share buyback. More details on equities here
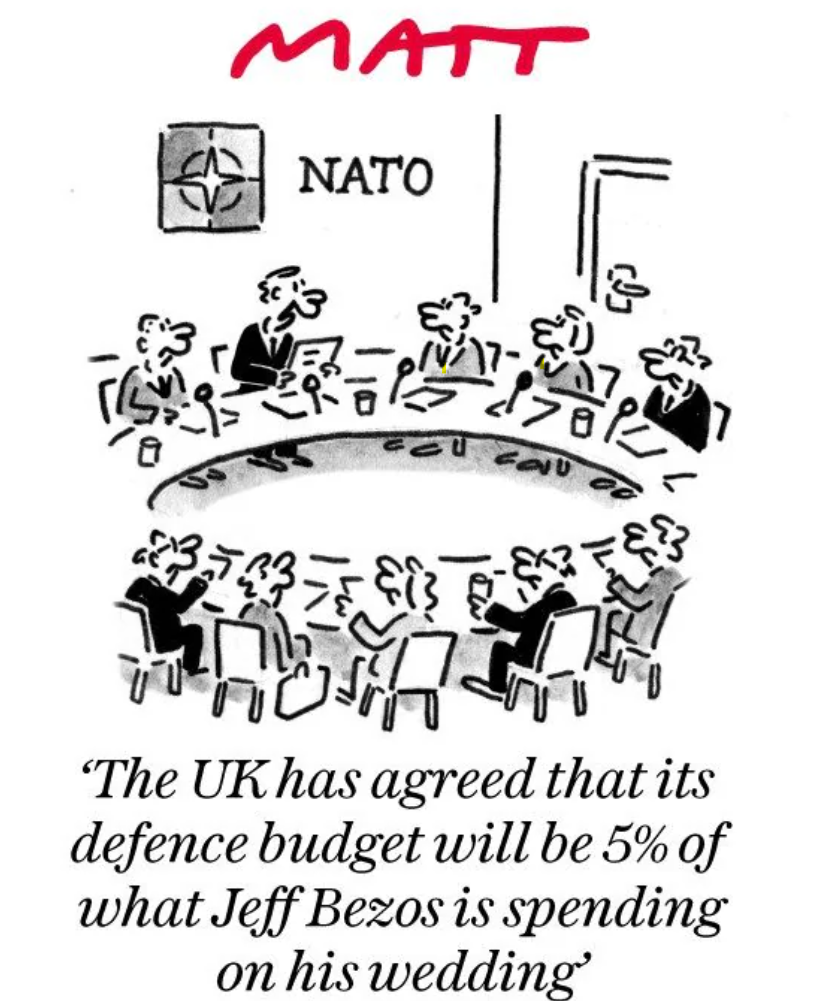
NATO: Agreement to 5% Defense spending target by 2035
but with variable geometry for each country
Sovereign spreads down with the Iran/Israël truce. Bunds did play their role as safe haven during the 12-days war.

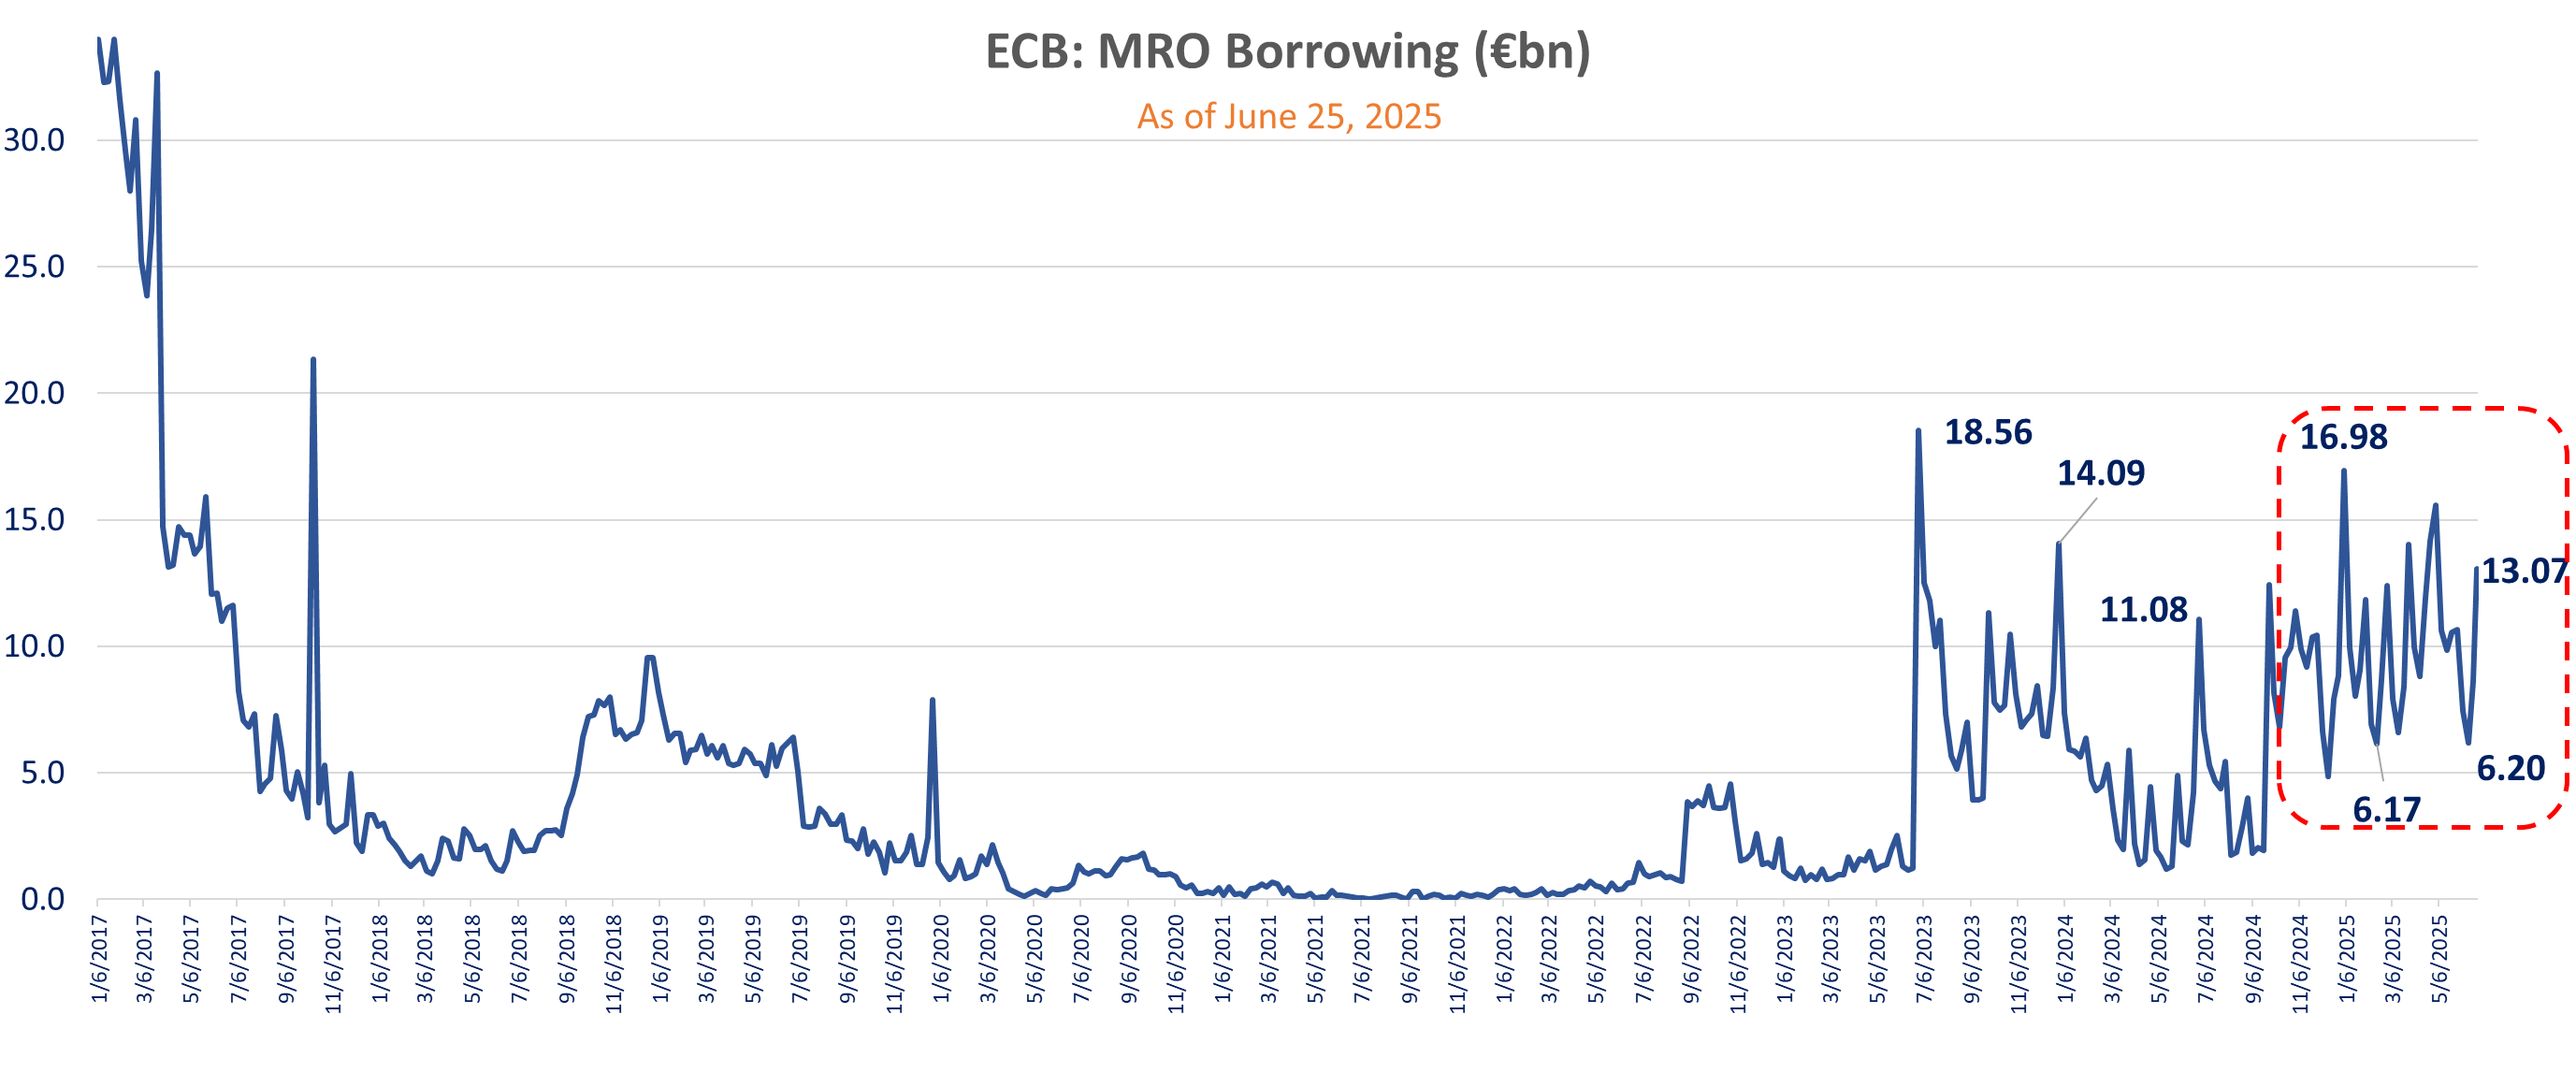
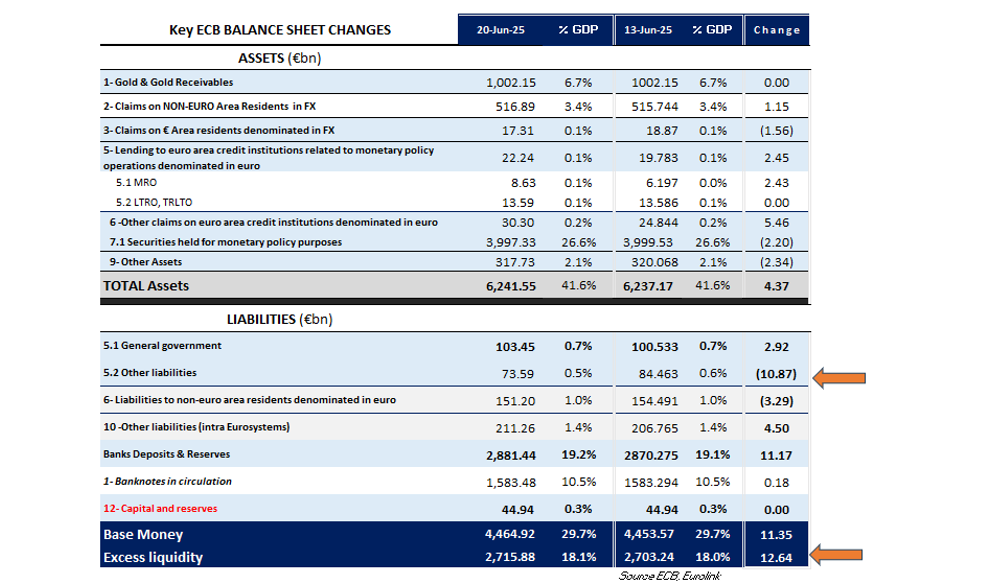
The ECB latest balance sheet snapshot as of Friday June 20, shows a week-over-week increase in Total Assets of €4.37bn, with the know increase in MRO borrowing of €2.43bn (last week Open Market Operation) and higher claims on Banks in (+€5.45bn) and claims in FX on non-Euro Area residents (+€1.15bn w/w), partially compensated by lower bond holdings (-€2.2bn) and other assets falling -€2.34bn w/w.
The 3-month LTRO is rolling this week with the March LTRO maturing on 06/25/2025 with a total €7.23bn due.
Today’s OMO shows the MRO borrowing increasing to €13.07bn (+€4.22bn from last week). It also shows the demand/allocation for the new LTRO (maturing past year end on 01/10/2025 Maturity, 98 days) at €6.39bn, i.e., a net decrease of only -€0.84bn. Overall a net increase of 3.38bn in bank borrowing from last week.
No significant changes in $ borrowing at the ECB 7 days $ facility.
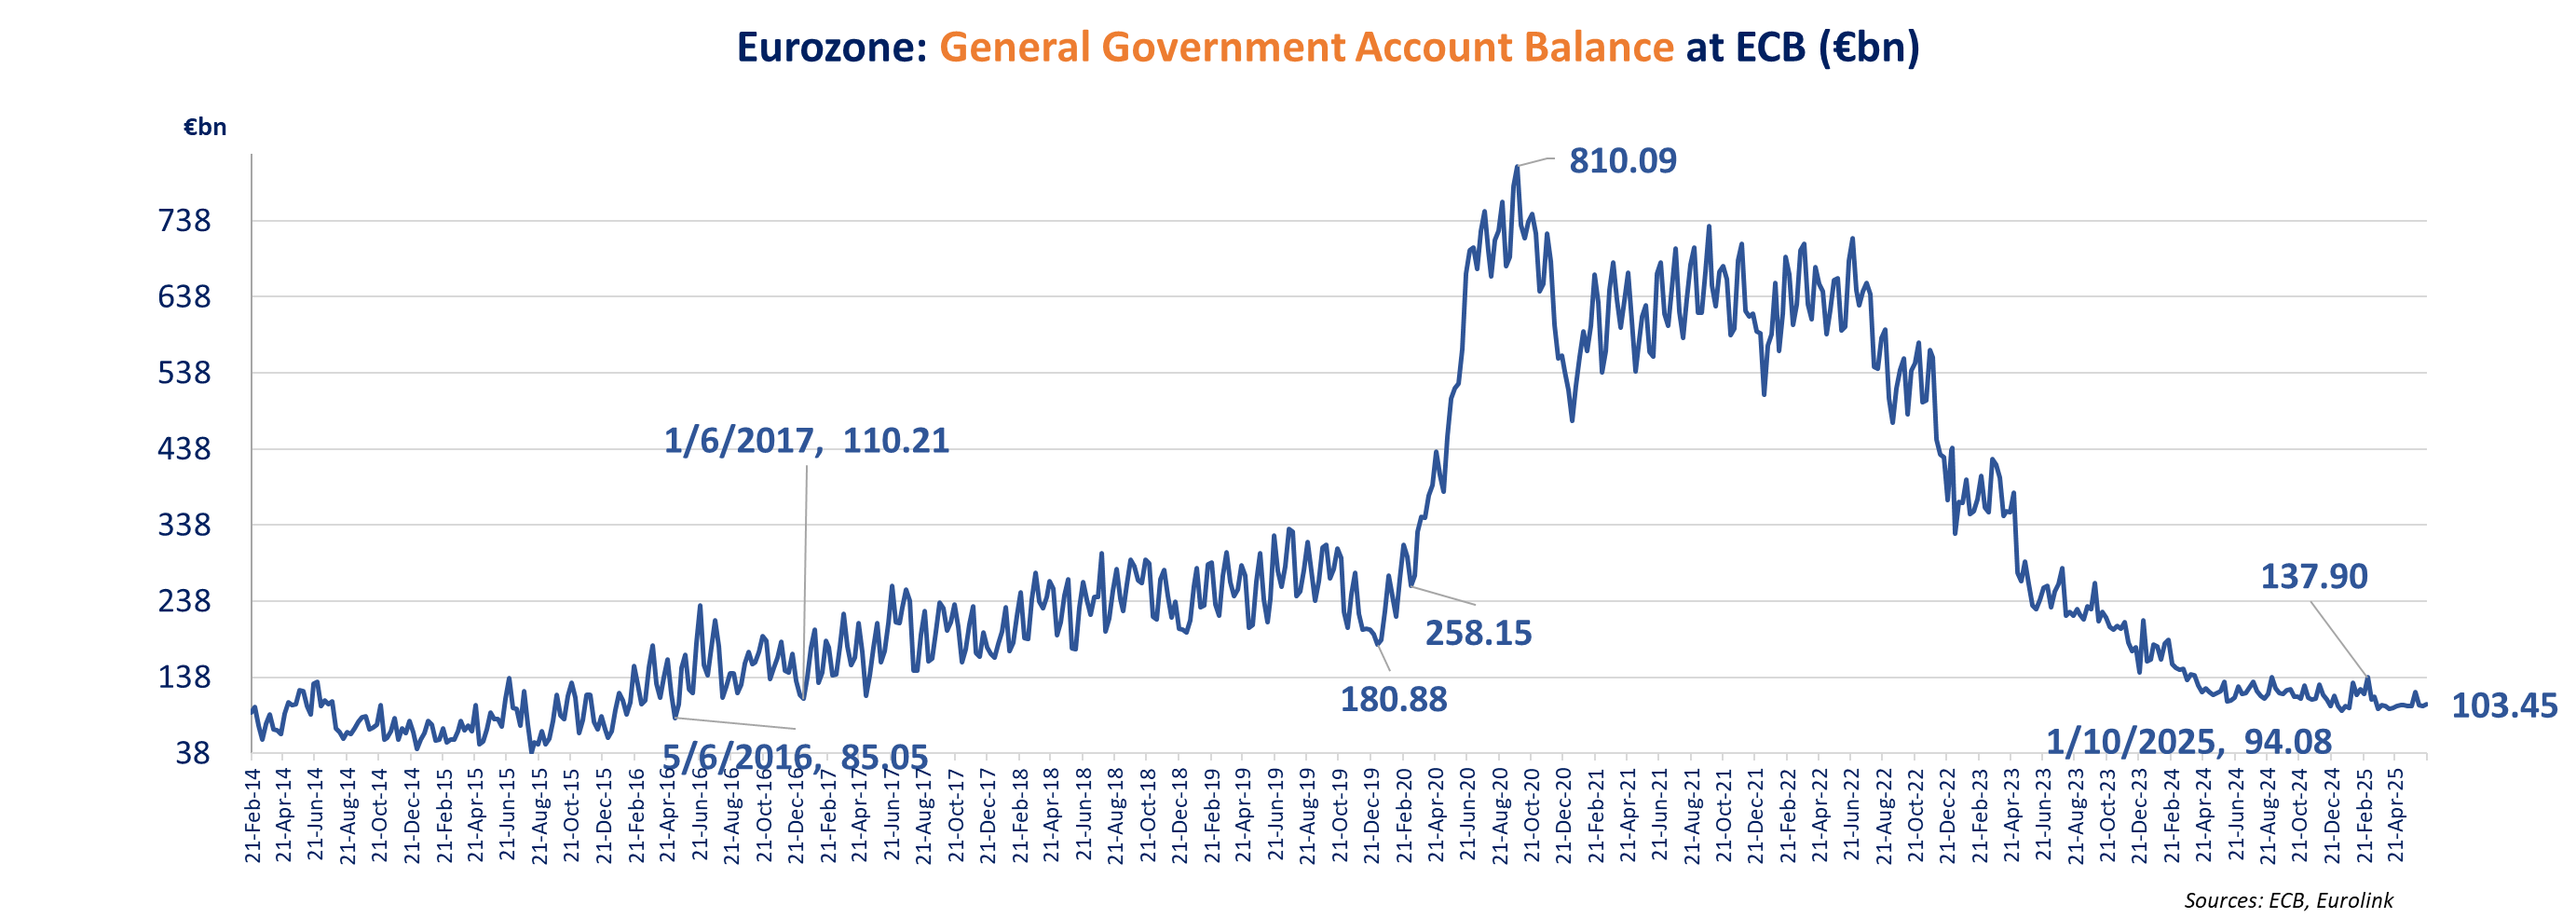
On the liabilities side, The General Government Account increased marginally by 2.92bn to 100.5bn along “other liabilities” up +€4.5bn – both reducing liquidity – but more than compensated by a decline in liabilities in € to non-Euro Area residents,(-3.3bn) and a -10.87bn drop in “other deposits, non-banks /non-government), both increasing liquidity.
At the end excess liquidity increased by 12.64bn and base money increased by 11.35bn for the week

France consumer confidence is about unchanged in June at 88.4 vs 88.3 in May (reported 88 in both cases), missing estimates for a slight improvement to 89. Confidence remains weak, far below the average of 100.
The unemployment fear eased only marginally (59.1 vs 60.8) after rising to the highest since March 2021 in May. We saw lower unemployment fear in Belgium, the Netherlands and Denmark in the last few days reports. Contrary to these countries French consumers economic outlook in the next 12 months did not improve (-59.7 vs -59.3).
Future price expectations is slightly lower at -37.8 vs -38.1.
French households’ assessment of the past financial situation is up modestly at -24 vs -25 but is about unchanged for expectations (-13.9 vs -13.6).
Consumers sees opportunity to make large purchases about as negative as in May (-26.6 vs -27.4) but on the other hand see a greater opportunity to save (39.9 vs 35.8) and increasing capacity to do so (currently 17.1 vs 16.7 and future 11.8 vs 10.0. Households are more negative on car purchases (-76 vs -75) or capital goods 9-6 vs -4) and less negative for buying a dwelling (-86 vs -87)

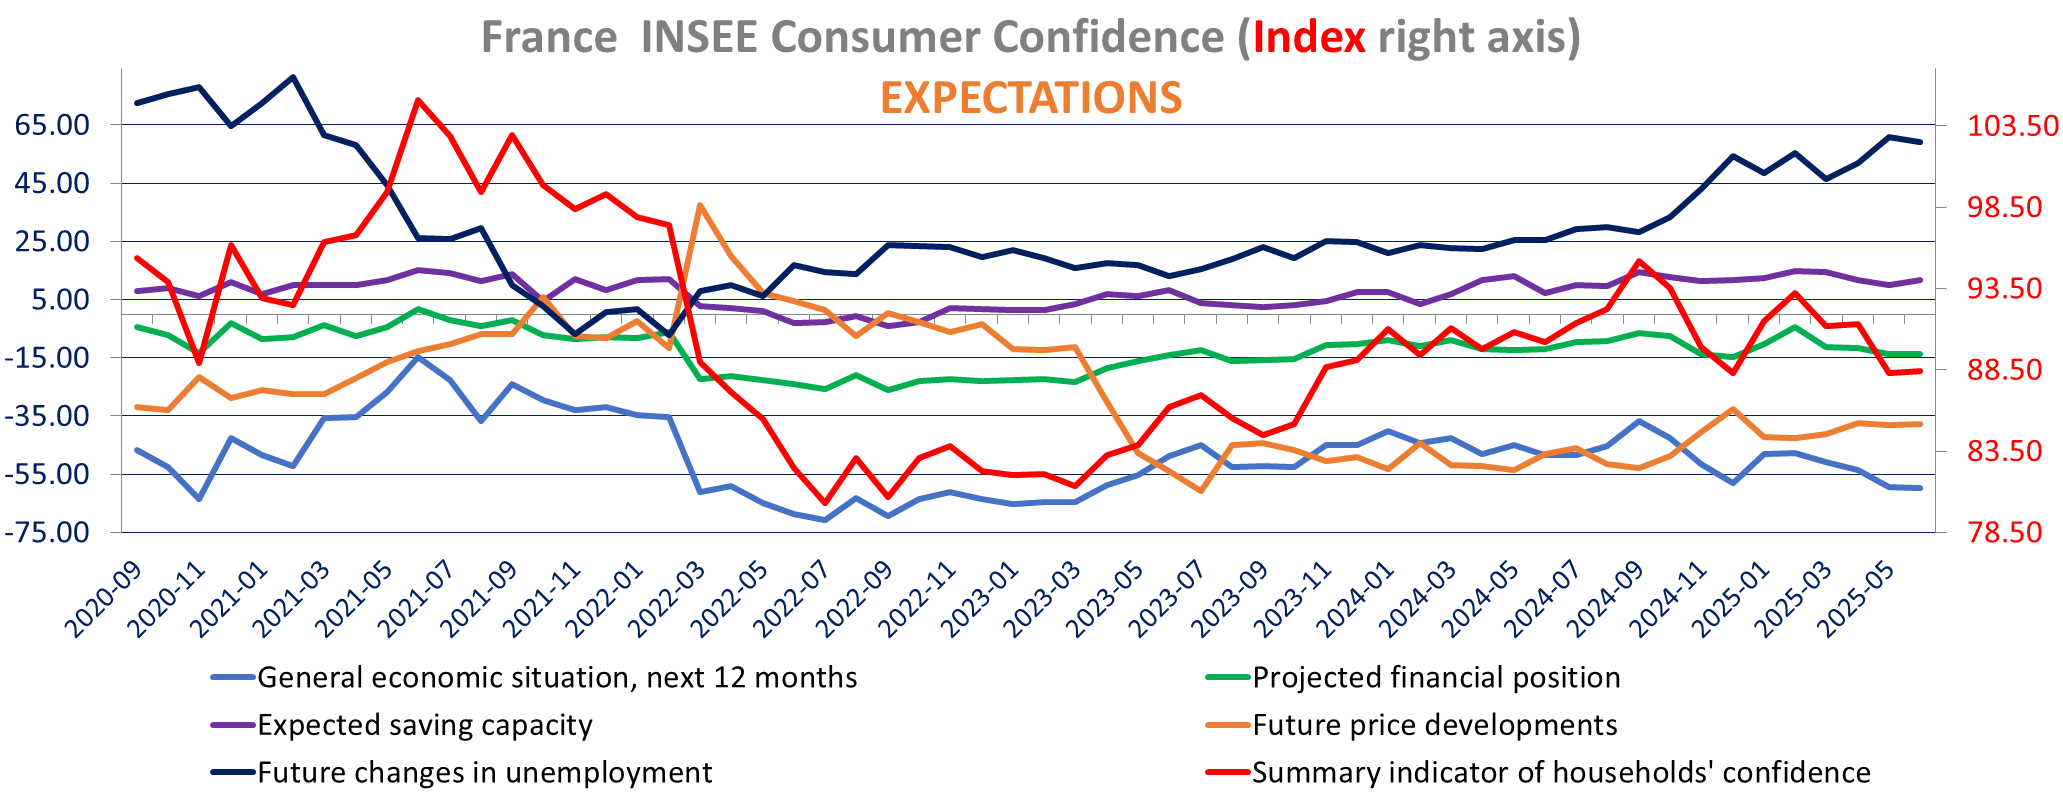
The confidence of French consumers is comparatively lower than that of their counterparts, with very weak (and not improving) view on the economic outlook, and higher unemployment fear:

The Belgium NBB business confidence increased in June to the best in level in more than two years (May 2023) at -10.1 vs -13.5 in May.
Manufacturing continues to recover with strong Jump in climate to -11.6 vs -16.1, up for the 3rd consecutive month and to the highest level since March 2023). The improvement stems from higher demand expectations and a better appraisal of total orders. The current situation is weaker. Intermediate goods and capital goods saw greater improvement in sentiment, while consumer goods climate decline.
Services sentiment also bounced back significantly in June to -2.6 from -9 in May to a 4-month high also driven by higher expectations about demand and activity, but also a slightly better appraisal of the current situation. Transport and support activities switched back to positive for the first time since last November.
Construction sentiment declined (-10.2 vs -7.5) on weaker activity and orderbook. Roofing is the only subsector posting and improvement.
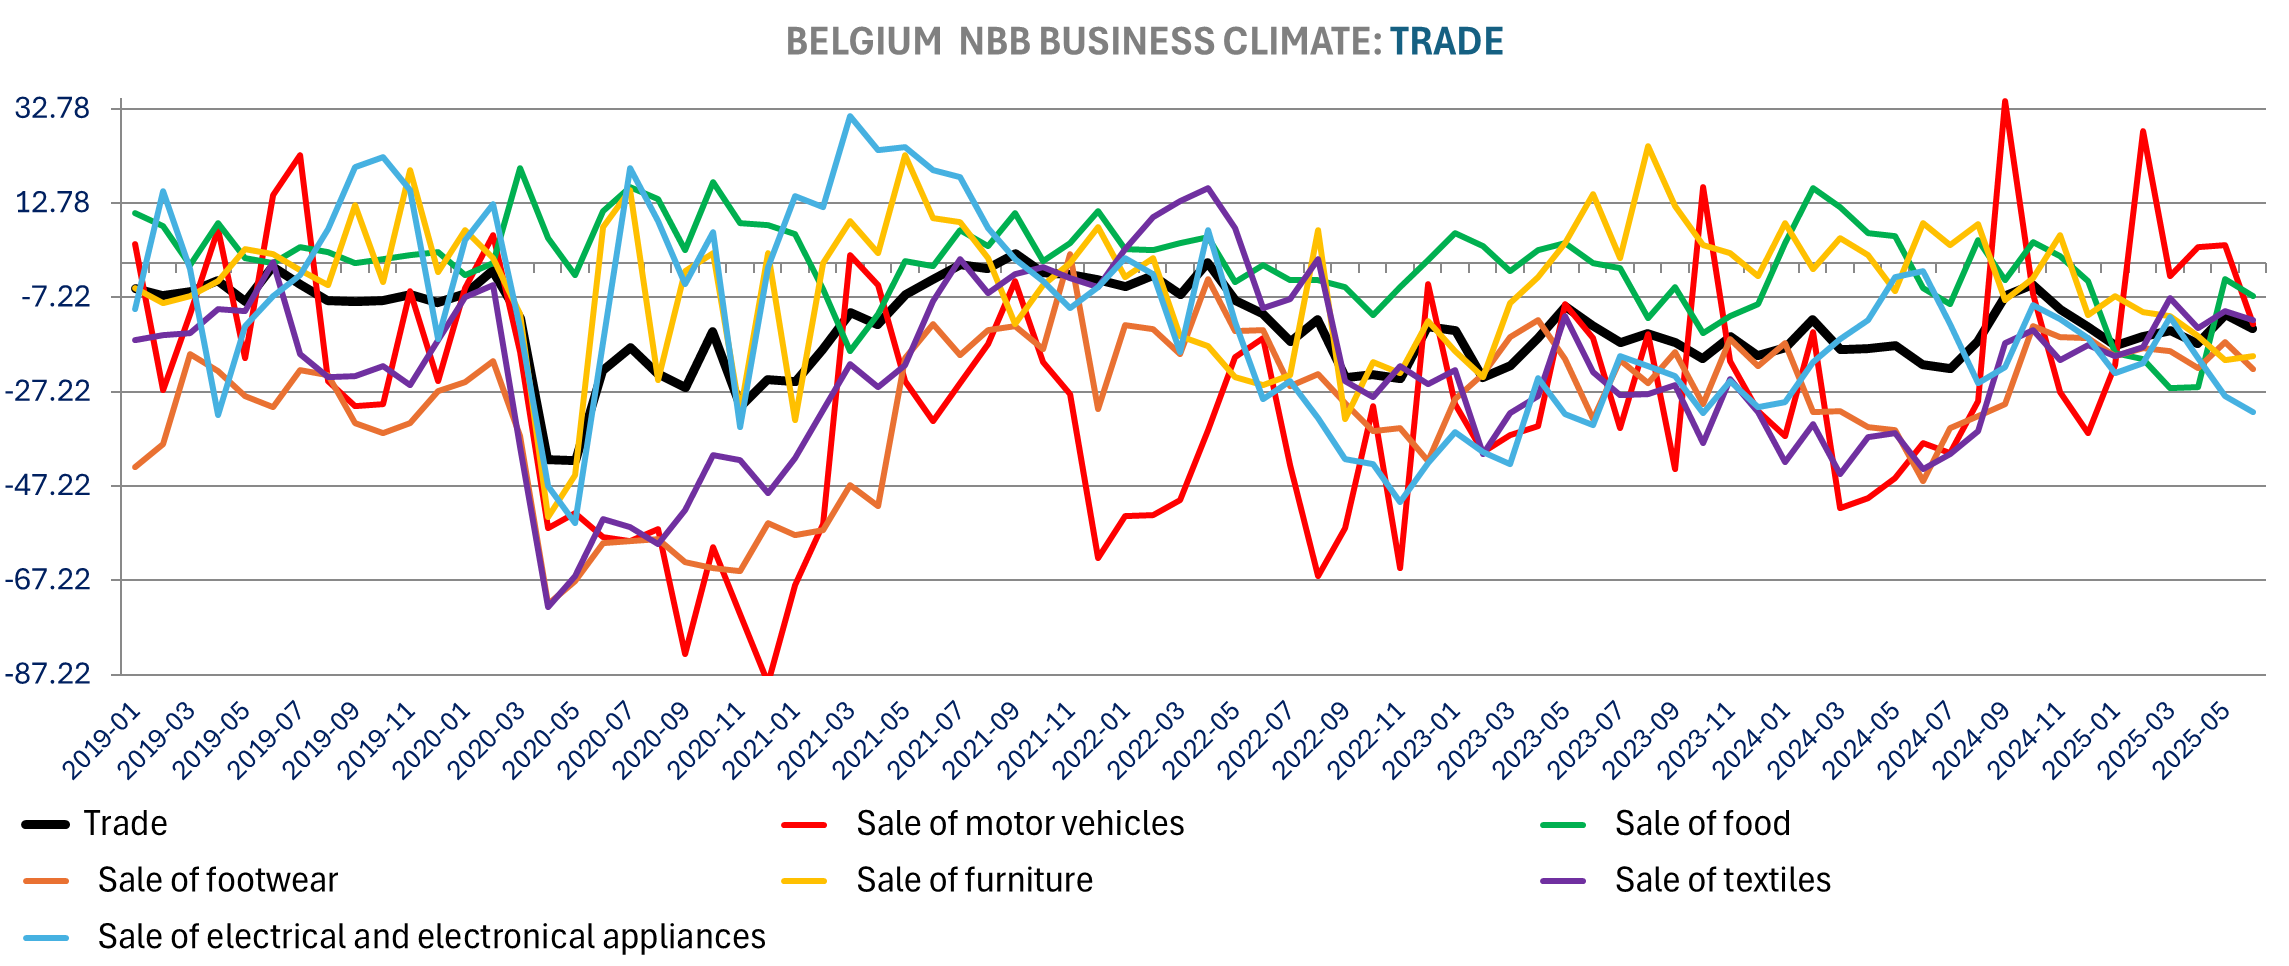
Trade climate also weakened in June (-13.9 vs -10.9) with a sharp decline in expected demand (-19.3 vs -9.1, reversing most or May’s improvement). Climate for Trade in food, motor vehicles, textiles, footwear, appliances weakened.
Employment expectations improved for all four sectors, improving the most for services (13.9 vs 9, best since October) and construction (-2.5 vs -6.6).
Price expectations have declined notably for manufacturing (3.3 vs 9.4) and trade (12.3 vs 16.9), reaching their lowest points since November and December, respectively. Price expectations increased slightly for services (15.8 vs 15.2, highest since February) and construction (-3.1 vs -3.7). Overall, there is limited price pressure in manufacturing, however, as we saw with the Flash PMI we have a slight acceleration in services.


EUROPEAN CAR REGISTRATIONS (May)
The EU 27 car registrations are up 1.6% yoy to 926,582 vehicles remaining below the last 10yr average, bringing the Year-to-date registrations down -0.6% yoy, improving from -1.2% yoy ytd in April. For the EU +EFTA+UK, registrations are up +1.9% yoy and now up +0.1% yoy year to date with robust growth in Norway (+39.1%yoy). ACEA Release.
Within the Eurozone Spain (+18.6%yoy), Austria (+22.7%), Greece (+13.9%) , Lithuania (+43.8%) and Latvia (+27.8%) posted the strongest growth, while France (-12.3% yoy), Belgium (-11.7%), Finland (-12%) an Estonia (-25.9%) were the weakest on a year-over-year basis. Within the EU 27 registrations were also up double-digits in Denmark (+23.3%), Hungary (+14.3%) and Bulgaria (+19.7%) and down -32.7% yoy in Romania.
In the EU, we saw sharp decline in Diesel engine registrations down -27.6% yoy in May with a share of 9.2% (13% share a year ago). Gasoline declined -18.6% yoy with a share or registrations down yoy 28.5% (35.6% a year ago).
Hybrid (HEV) gained the most share yoy, up 4.2points to 34.1% with registrations up 16% yoy in May. The strongest growth was for Pug-in-Hybrid (PHEV) up 46.9% yoy with share of 9.4% (6.5% a year ago). EV registrations are up 25% yoy with share of 15.4% gaining 2.9 pts.
On a year-to-date basis for the EU, EV are up 26.1% yoy (15.4% share), HEV is up +19.7% (35.1% share), PHEV +15.2% yoy (share of 8.4%). Ytd diesel registrations are down -26.6%, gasoline -20.2% yoy with respective share of 9.5% (down -3.4pts yoy) and 28.6% (down 7points!) – see detailed tables Year-to-Date.
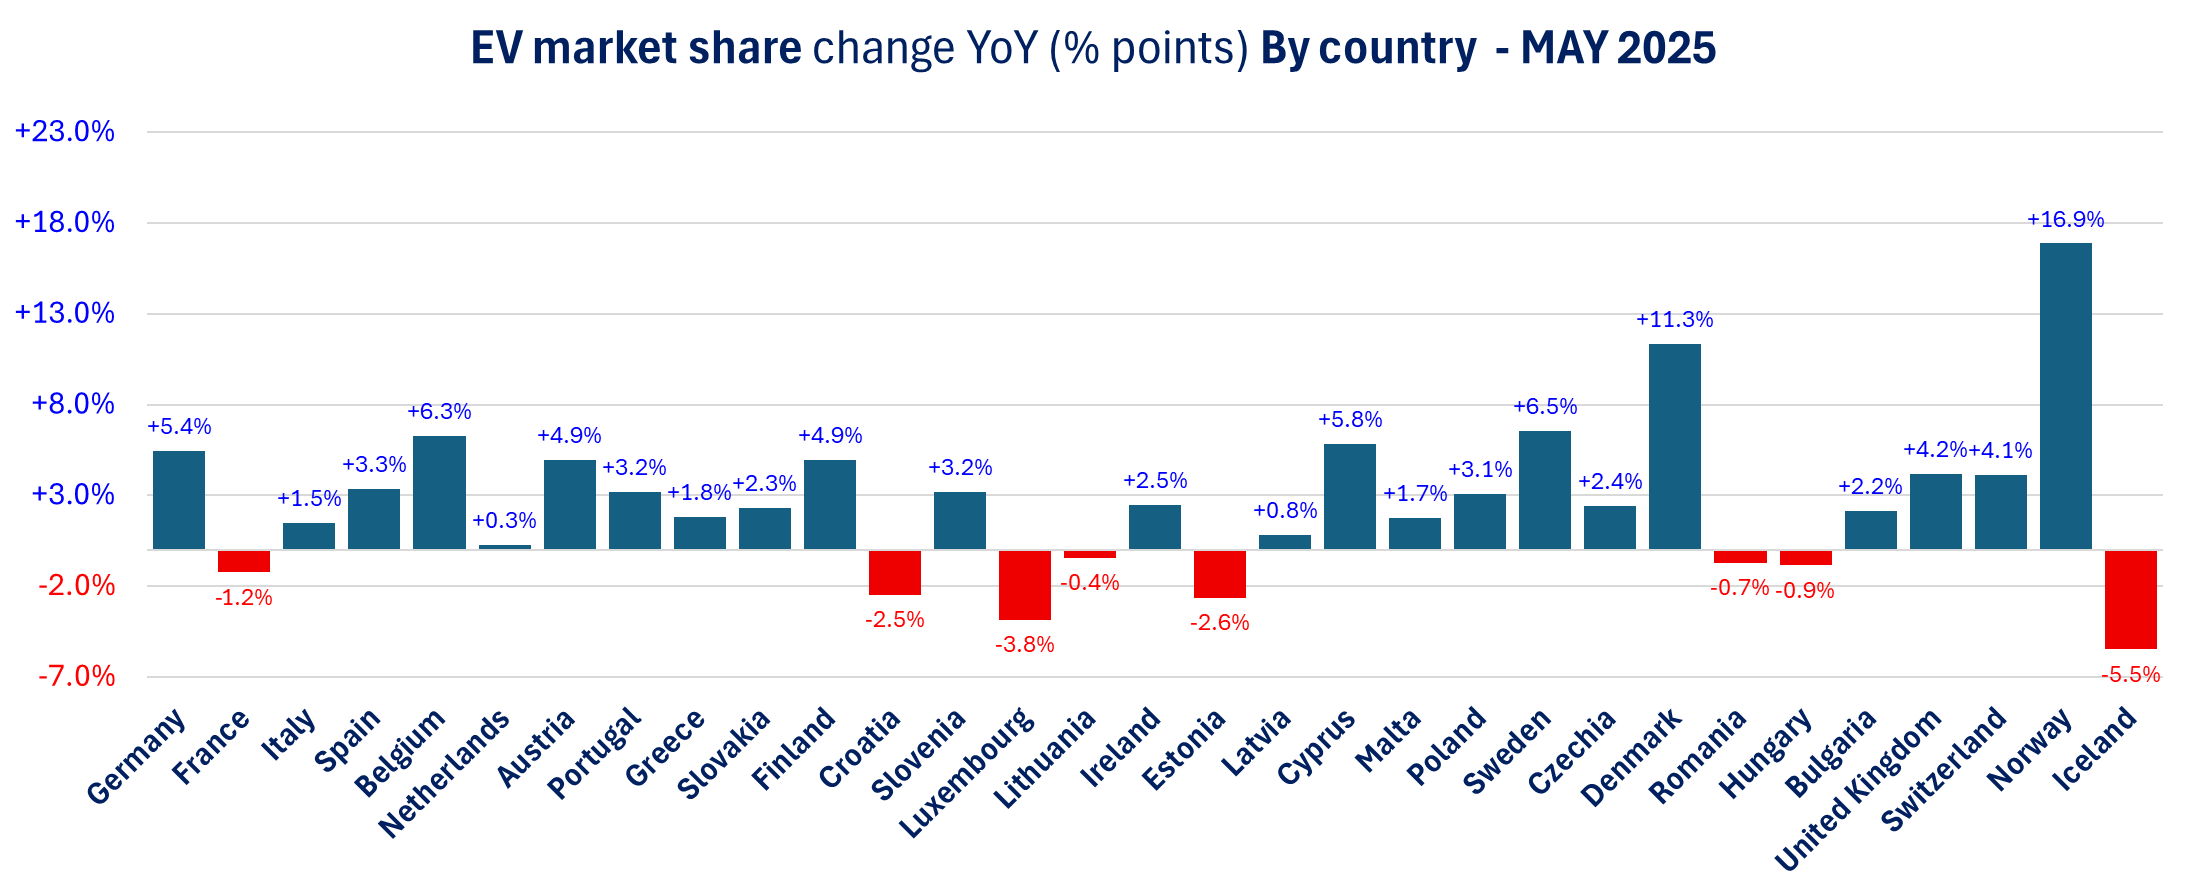
In May, EV gained +11.3 points in share in Denmark from May 2024, +6.3 points in Belgium, +6.5 points in Sweden, +5.4 points in Germany, +4.9 points in Finland and Austria. EV lost share in France -1.2 points with sales now down -7.1% ytd yoy. See detailed tables month of May.


Year-to-Date Detailed Tables


|
|
Wednesday, June 25, 2025 | ||
|
BAB | |||
|
GBp |
1160.00 |
+12.29% | |
|
BAB |
Revenue of £4,831.3 million was 11% higher than FY24 on an organic basis, driven by strong growth in Nuclear and Marine. Marine revenue increased 12% (at constant FX) to £1,576.4 million. Nuclear revenue increased 19% (at constant FX) to £1,816.0 million led by strong growth in the Cavendish Nuclear business (+28%) driven by the expansion of new civil nuclear projects. Land revenue increased 2% (at constant FX) to £1,116.6 million. Aviation revenue declined 4% (at constant FX) to £322.3 million primarily due to completion of the aircraft delivery phase in the H160 French defense program. Underlying operating profit was up 53% to £363 million, in line with our post-close trading update. The prior year included two non-recurring items, a £90 million contract loss and a one-off £17 million profit on disposal of property. | ||
|
|
|
|
|
|
SAB | |||
|
EUR |
457.50 |
+1.60% |
BBVA release |
|
SAB |
BBVA received the authorization from the Spanish government for its acquisition of Banco de Sabadell. However, BBVA said it is assessing the condition attached to the agreement notably the request that BBVA and Sabadell remain separate autonomous entities for 3 years. | ||
|
|
|
|
|
|
TRI |
Trigano SA | ||
|
EUR |
138.60 |
-0.14% |
|
|
TRI |
Q3 sales after market close | ||
|
|
|
|
|
|
Banco Bilbao Vizcaya Argentaria SA | |||
|
EUR |
12.75 |
-2.82% | |
|
BBVA |
BBVA received the authorization from the Spanish government for its acquisition of Banco de Sabadell. However, BBVA said it is assessing the condition attached to the agreement notably the request that BBVA and Sabadell remain separate autonomous entities for 3 years. | ||

Versus early hours:
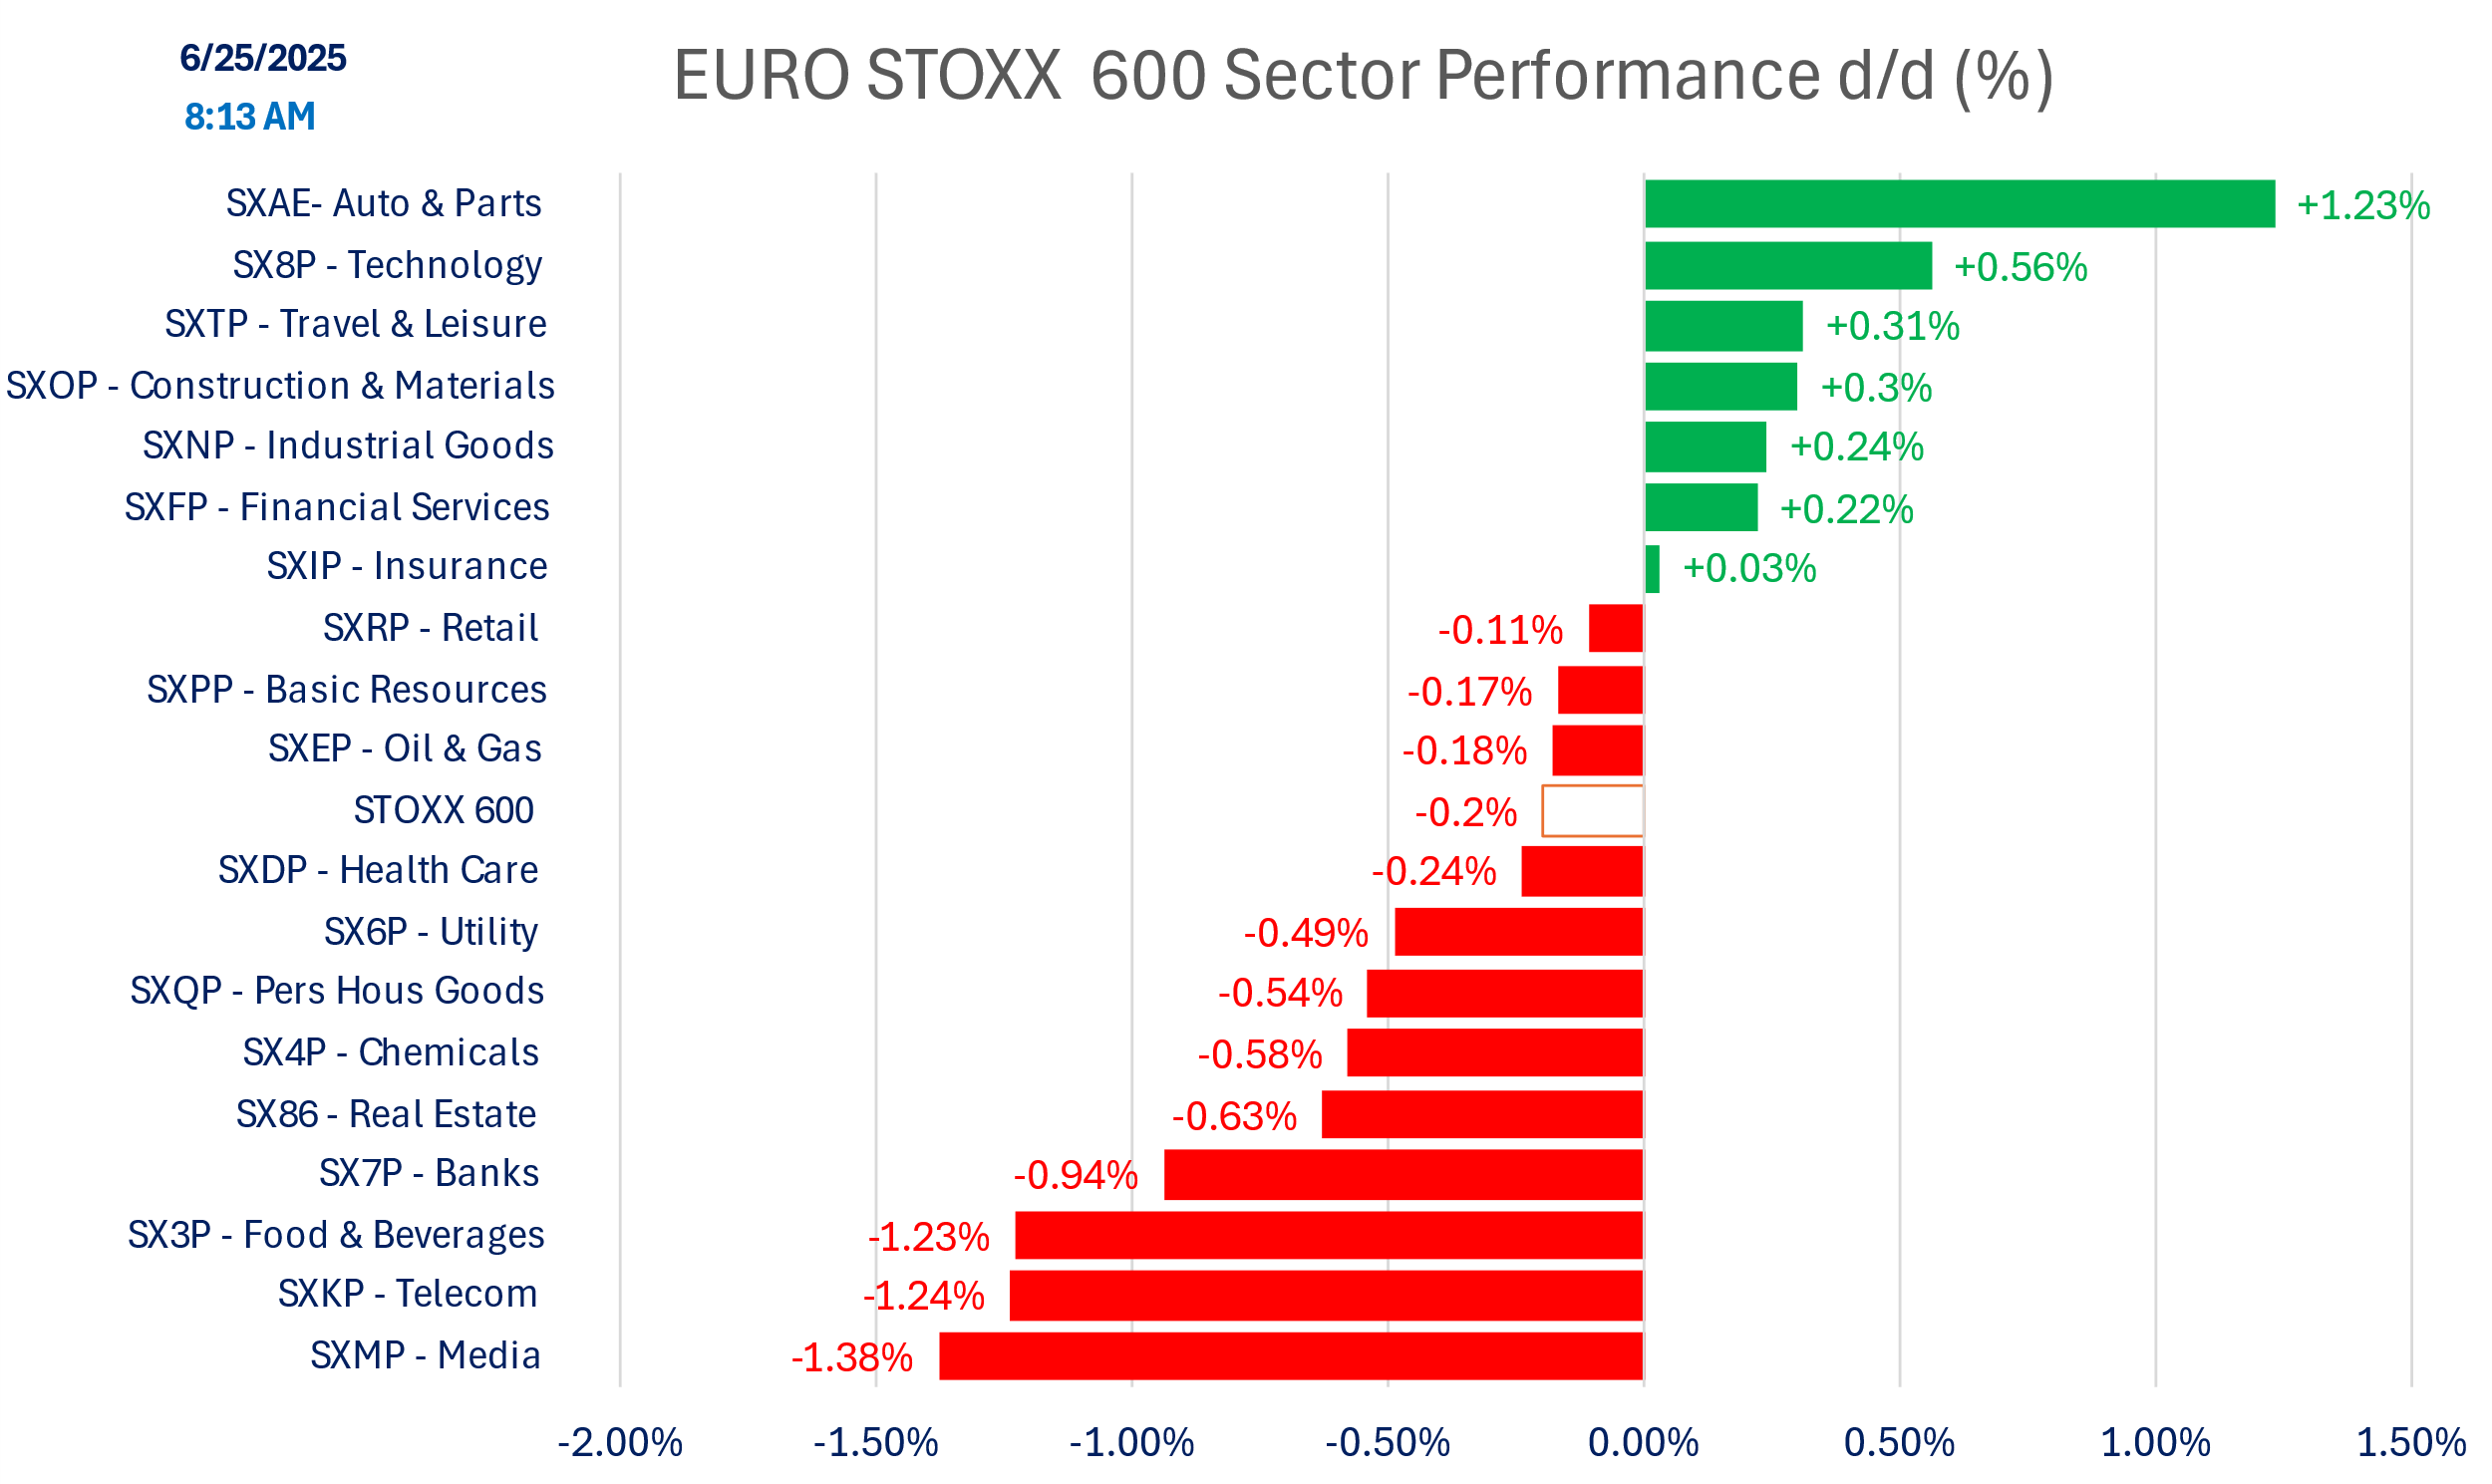
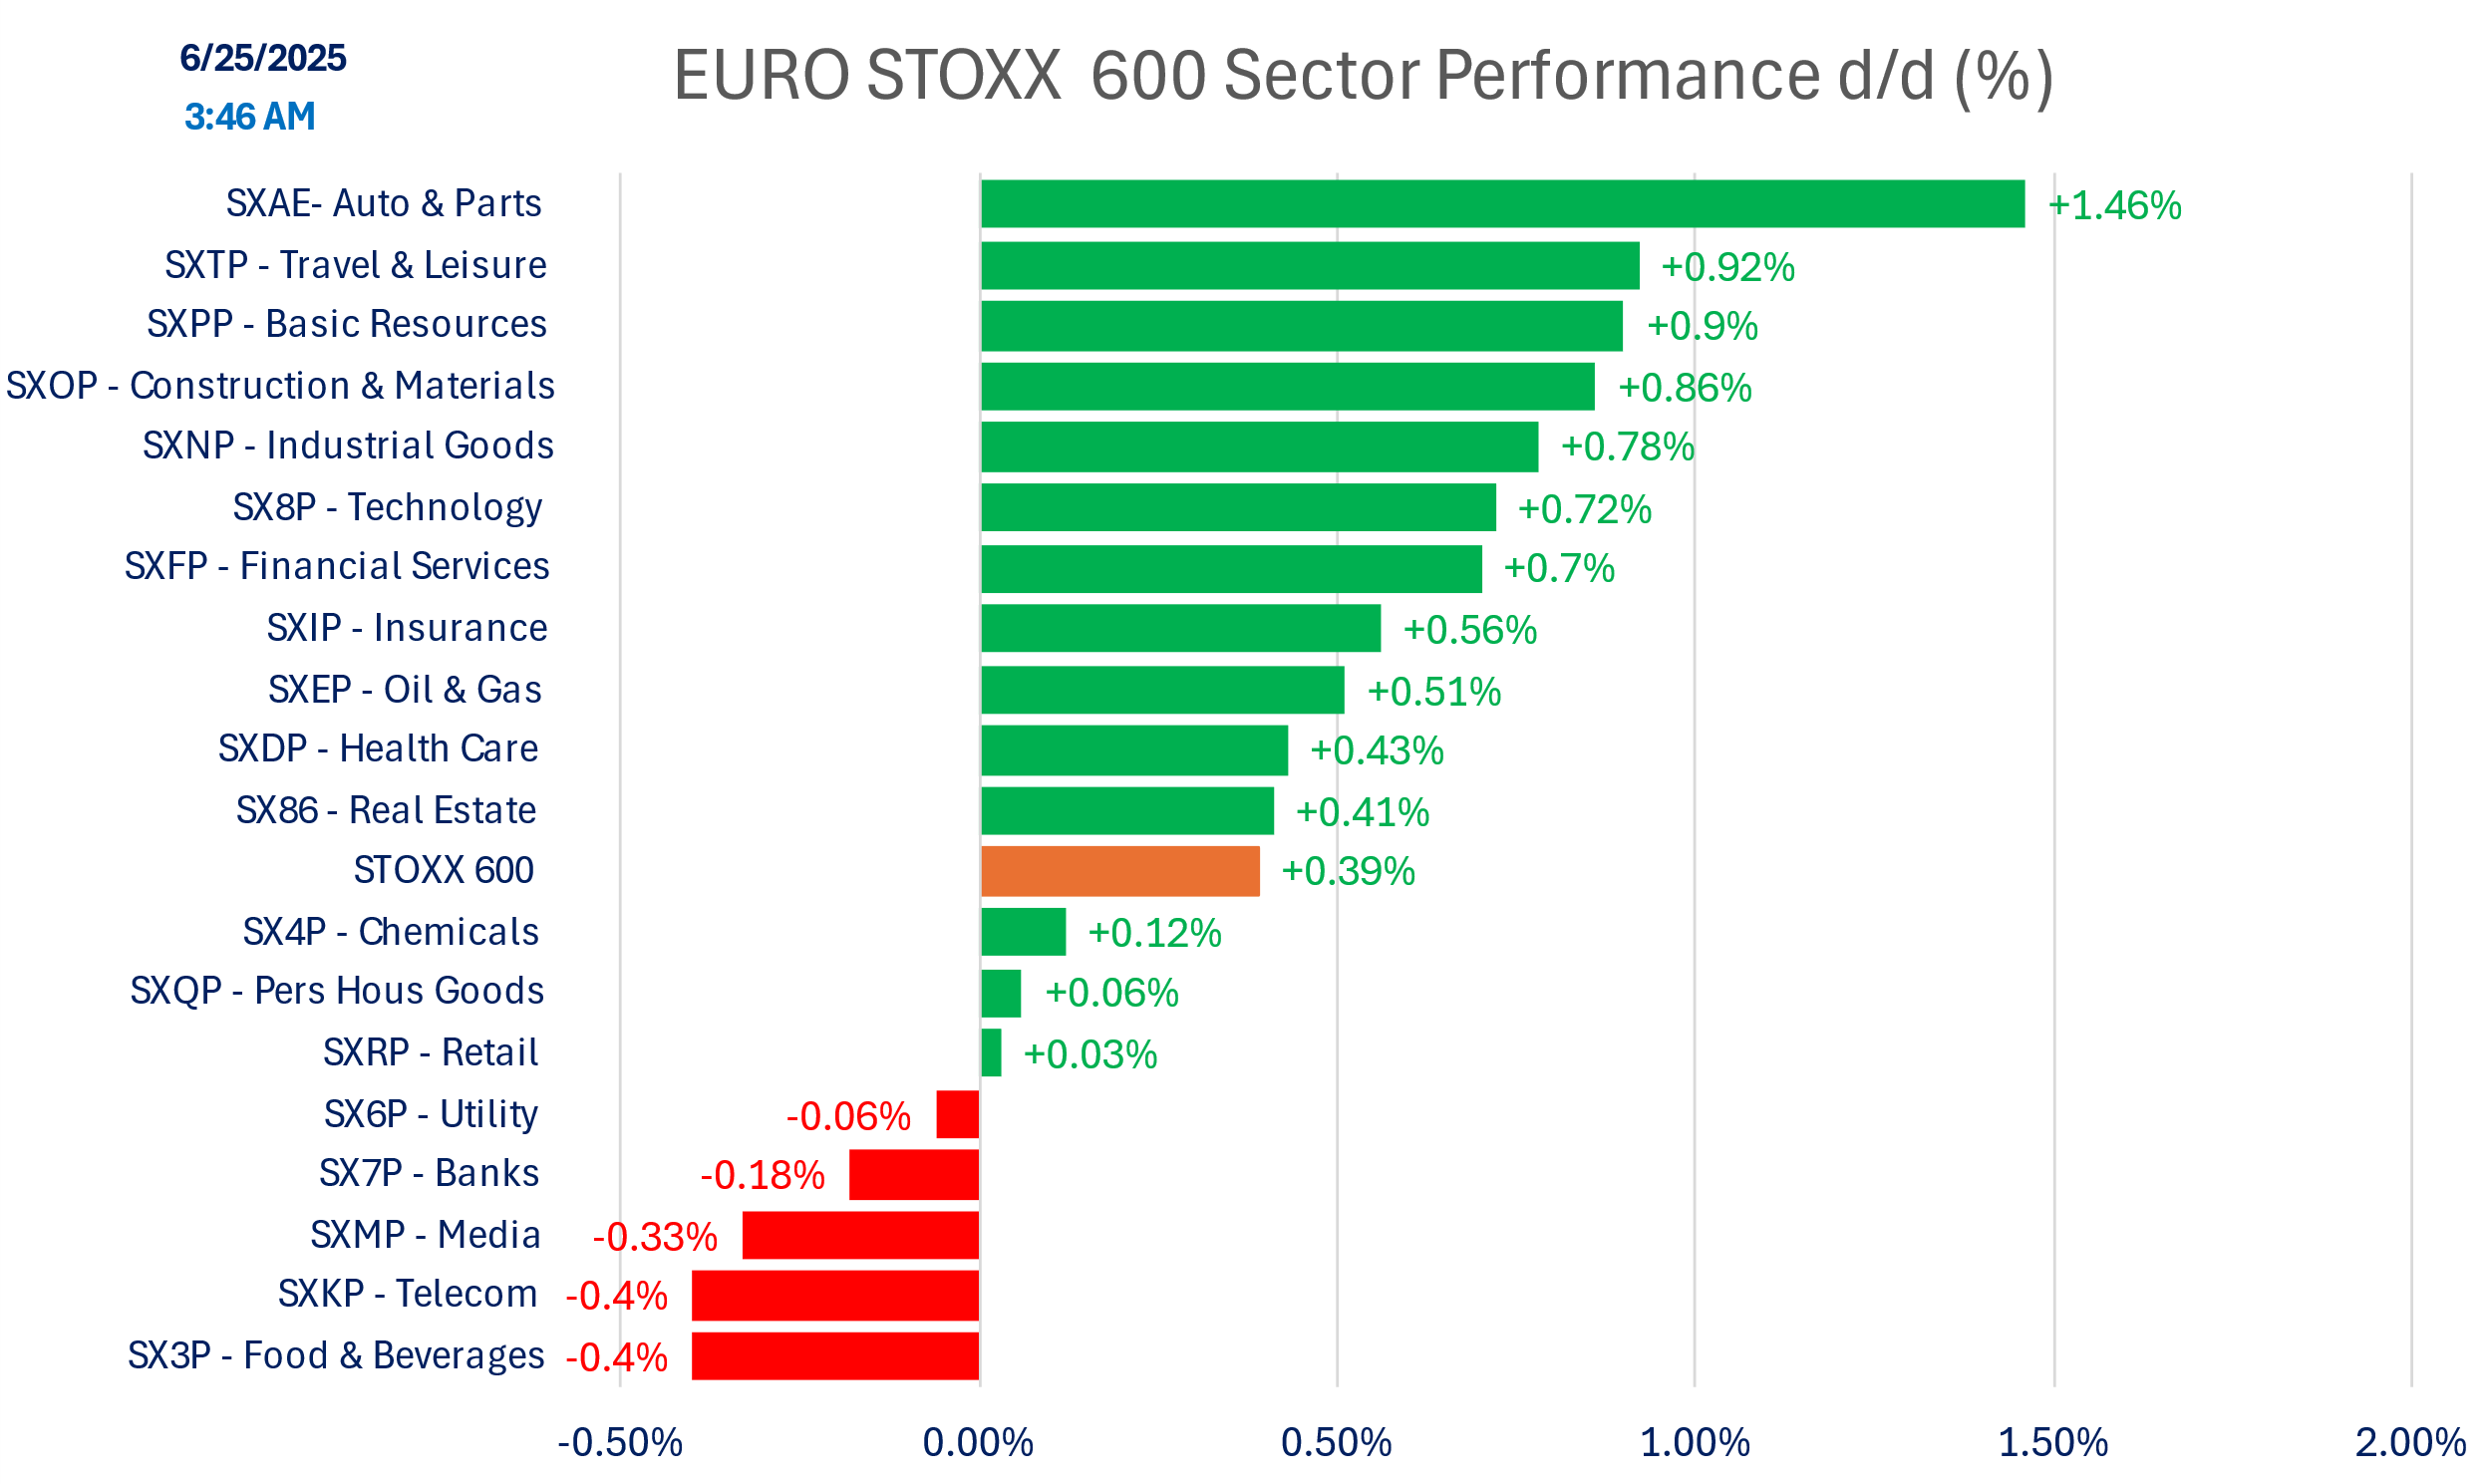
SECTOR PERFORMANCE
Relative performance to STOXX 600
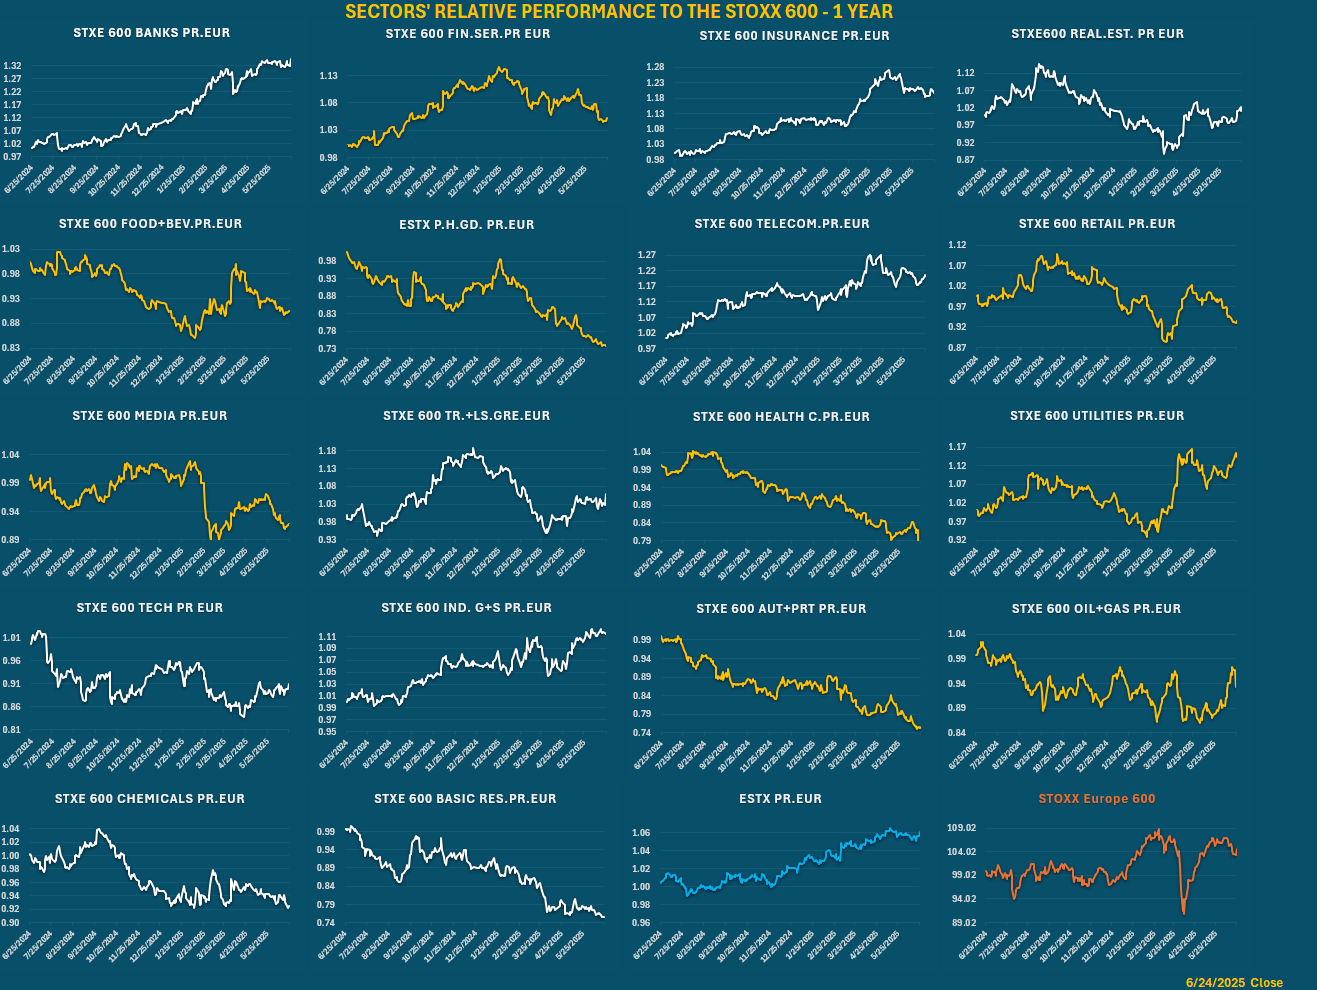
Today’s Performance
Versus early hours:

Indices

Versus early hours

Commodities

DISCLAIMER
This material is provided by Eurolink Securities L.L.C. for information purposes only and is not intended as a recommendation or an offer or solicitation for the purchase or sale of any security or financial instrument. The opinions, forecasts, facts, and recommendations contained here are based upon the information available as of the date of the report. The analysts are basing their opinions upon information they have received from sources they believe to be accurate and reliable. The report is directed exclusively at Institutional Investors who make their own decisions regardless of the present publication or opinions reflected within the report. This material is not a complete analysis of all material facts respecting any issuer, industry, or security or of your investment objectives, parameters, needs or financial situation, and therefore is not a sufficient basis alone on which to base an investment decision. A guarantee of completeness and accuracy of the information in this report is not assumed by Eurolink Securities LLC and any liability arising from the use of this report is excluded and disclaimed. The information contained herein is as of the date and time referenced above. Opinions and recommendations are subject to change without notice. Eurolink Securities L.L.C. has any obligation to update such information. Past performance is not indicative of future results. The investments discussed may fluctuate in price or value. Changes in rates of exchange may have an adverse effect on the value of investments. Transactions involving the financial instruments mentioned herein may not be suitable for all investors. Eurolink Securities L.L.C. has no obligation to continue to provide this research product and no such obligation is implied or guaranteed. The distribution rights of this report belong solely to Eurolink Securities L.L.C. It is prohibited to publish or to give this report or parts to third parties. No parts of it may be reproduced, resold, stored, or transmitted in any printed, electronic, or other form, or used for generating or marketing any printed or electronic publication, service, or product without Eurolink Securities LLC’s previous approval.