The May ECB CES shows further decline in consumer inflation expectations (2.8% vs 3.1% 12 months ahead) and 24% vs 2.5% 3 years ahead) and overall, some slightly higher optimism on income and employment.
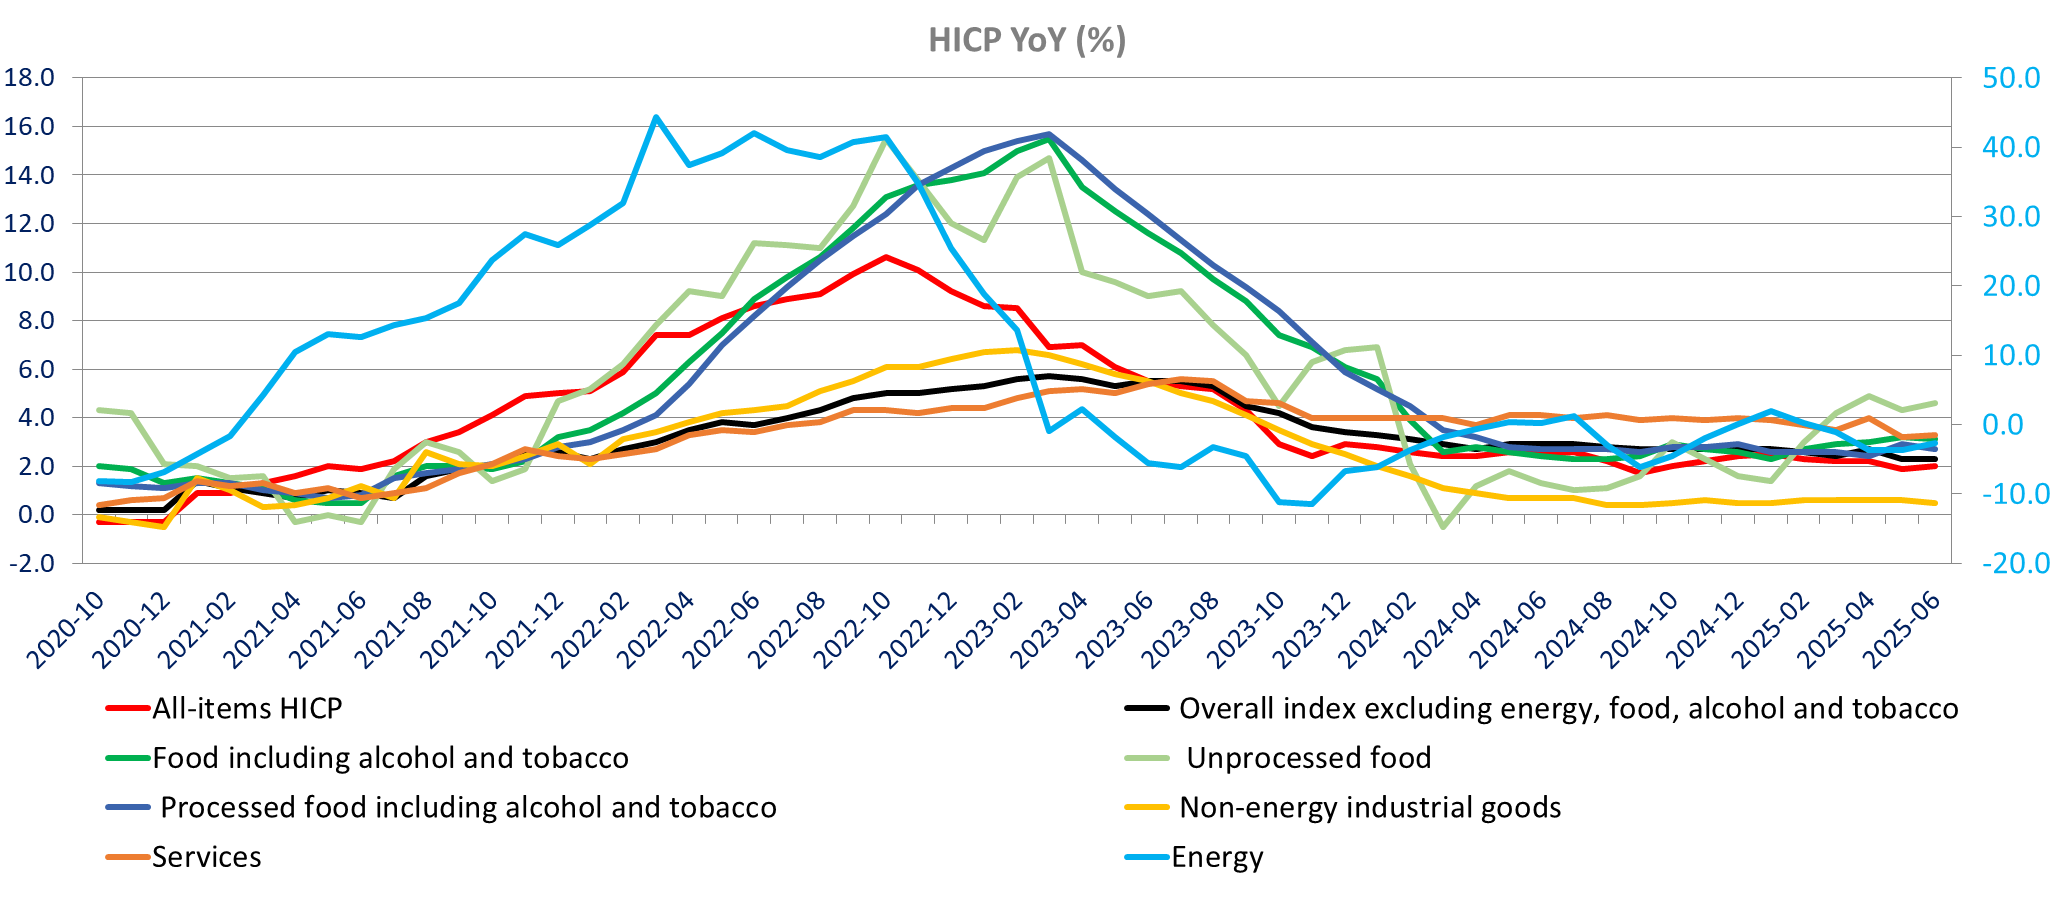
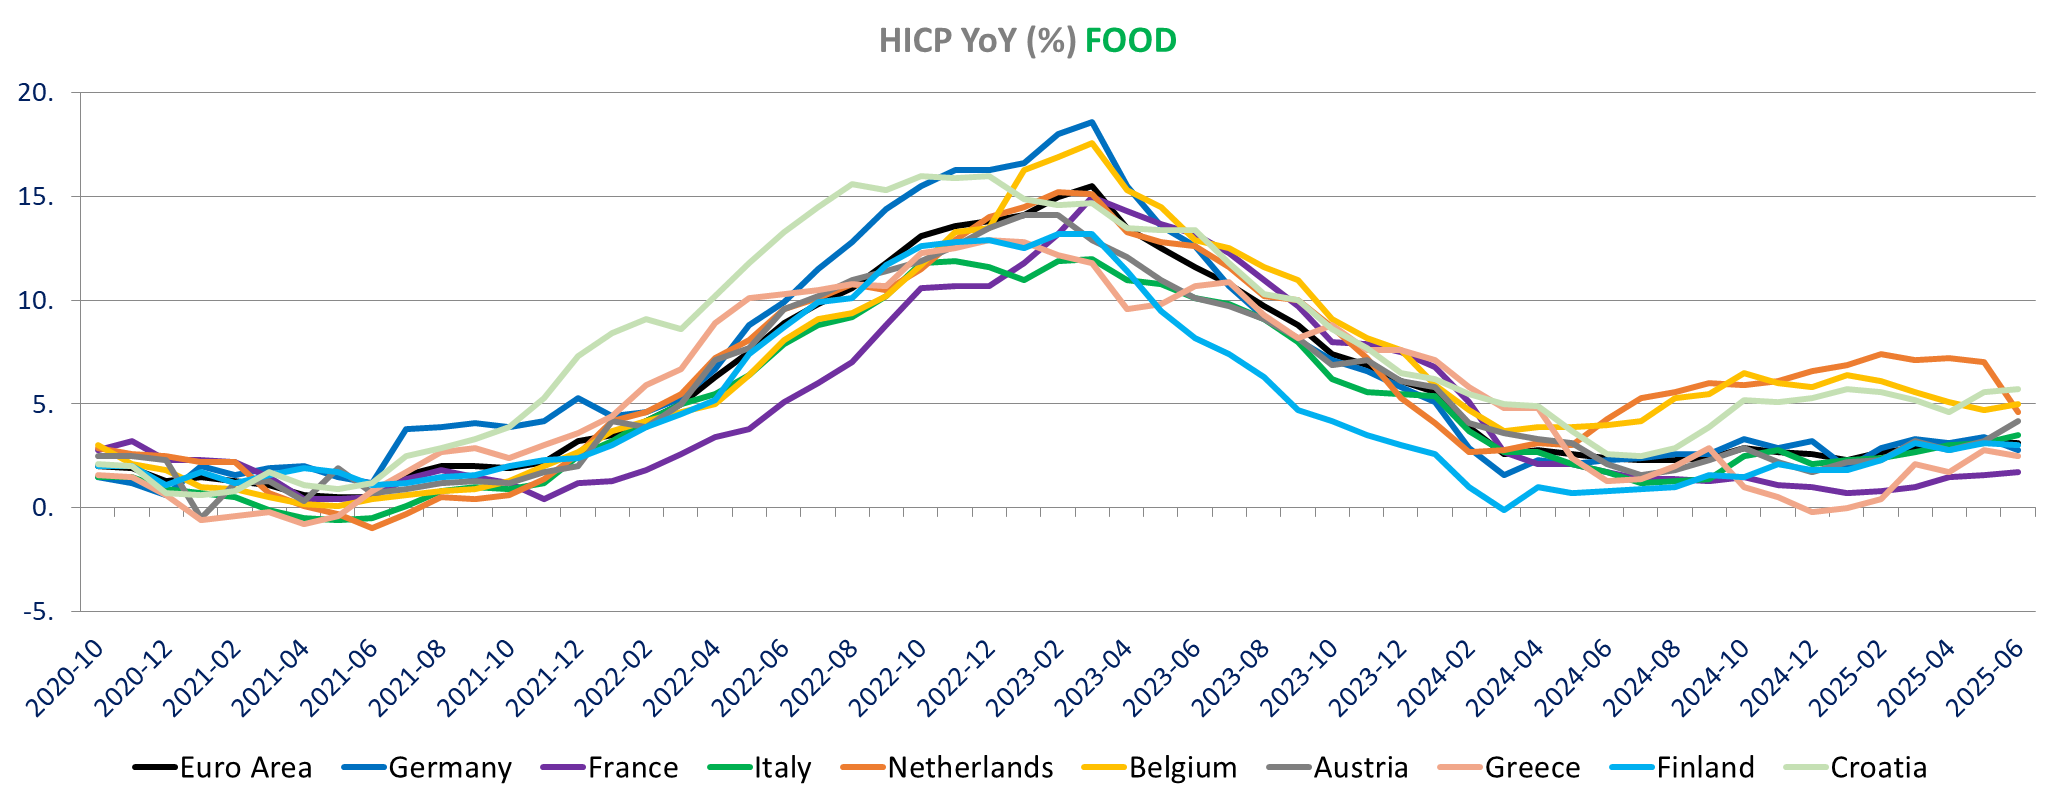
The June preliminary HICP is also in line with expectations, up at 2% from 1.9% and the core inflation is unchanged at 2.3% also as expected. Services inflation is higher at 3.3% up from 3.2% but at the core level it was compensated for by non-energy industrial goods including processed food (including alcohol and tobacco). Details shows that we have a sharp decline in processed food in the Netherlands, which in turns seem due to a sharp decline in tobacco inflation (tobacco was up +21.1% m/m in June 2024 on excise duty). We see the same – obviously – in the preliminary Dutch inflation published this morning.
All in all it suggest that the inflation data with higher services inflation is not that great and will convince the ECB to Stay put in July.
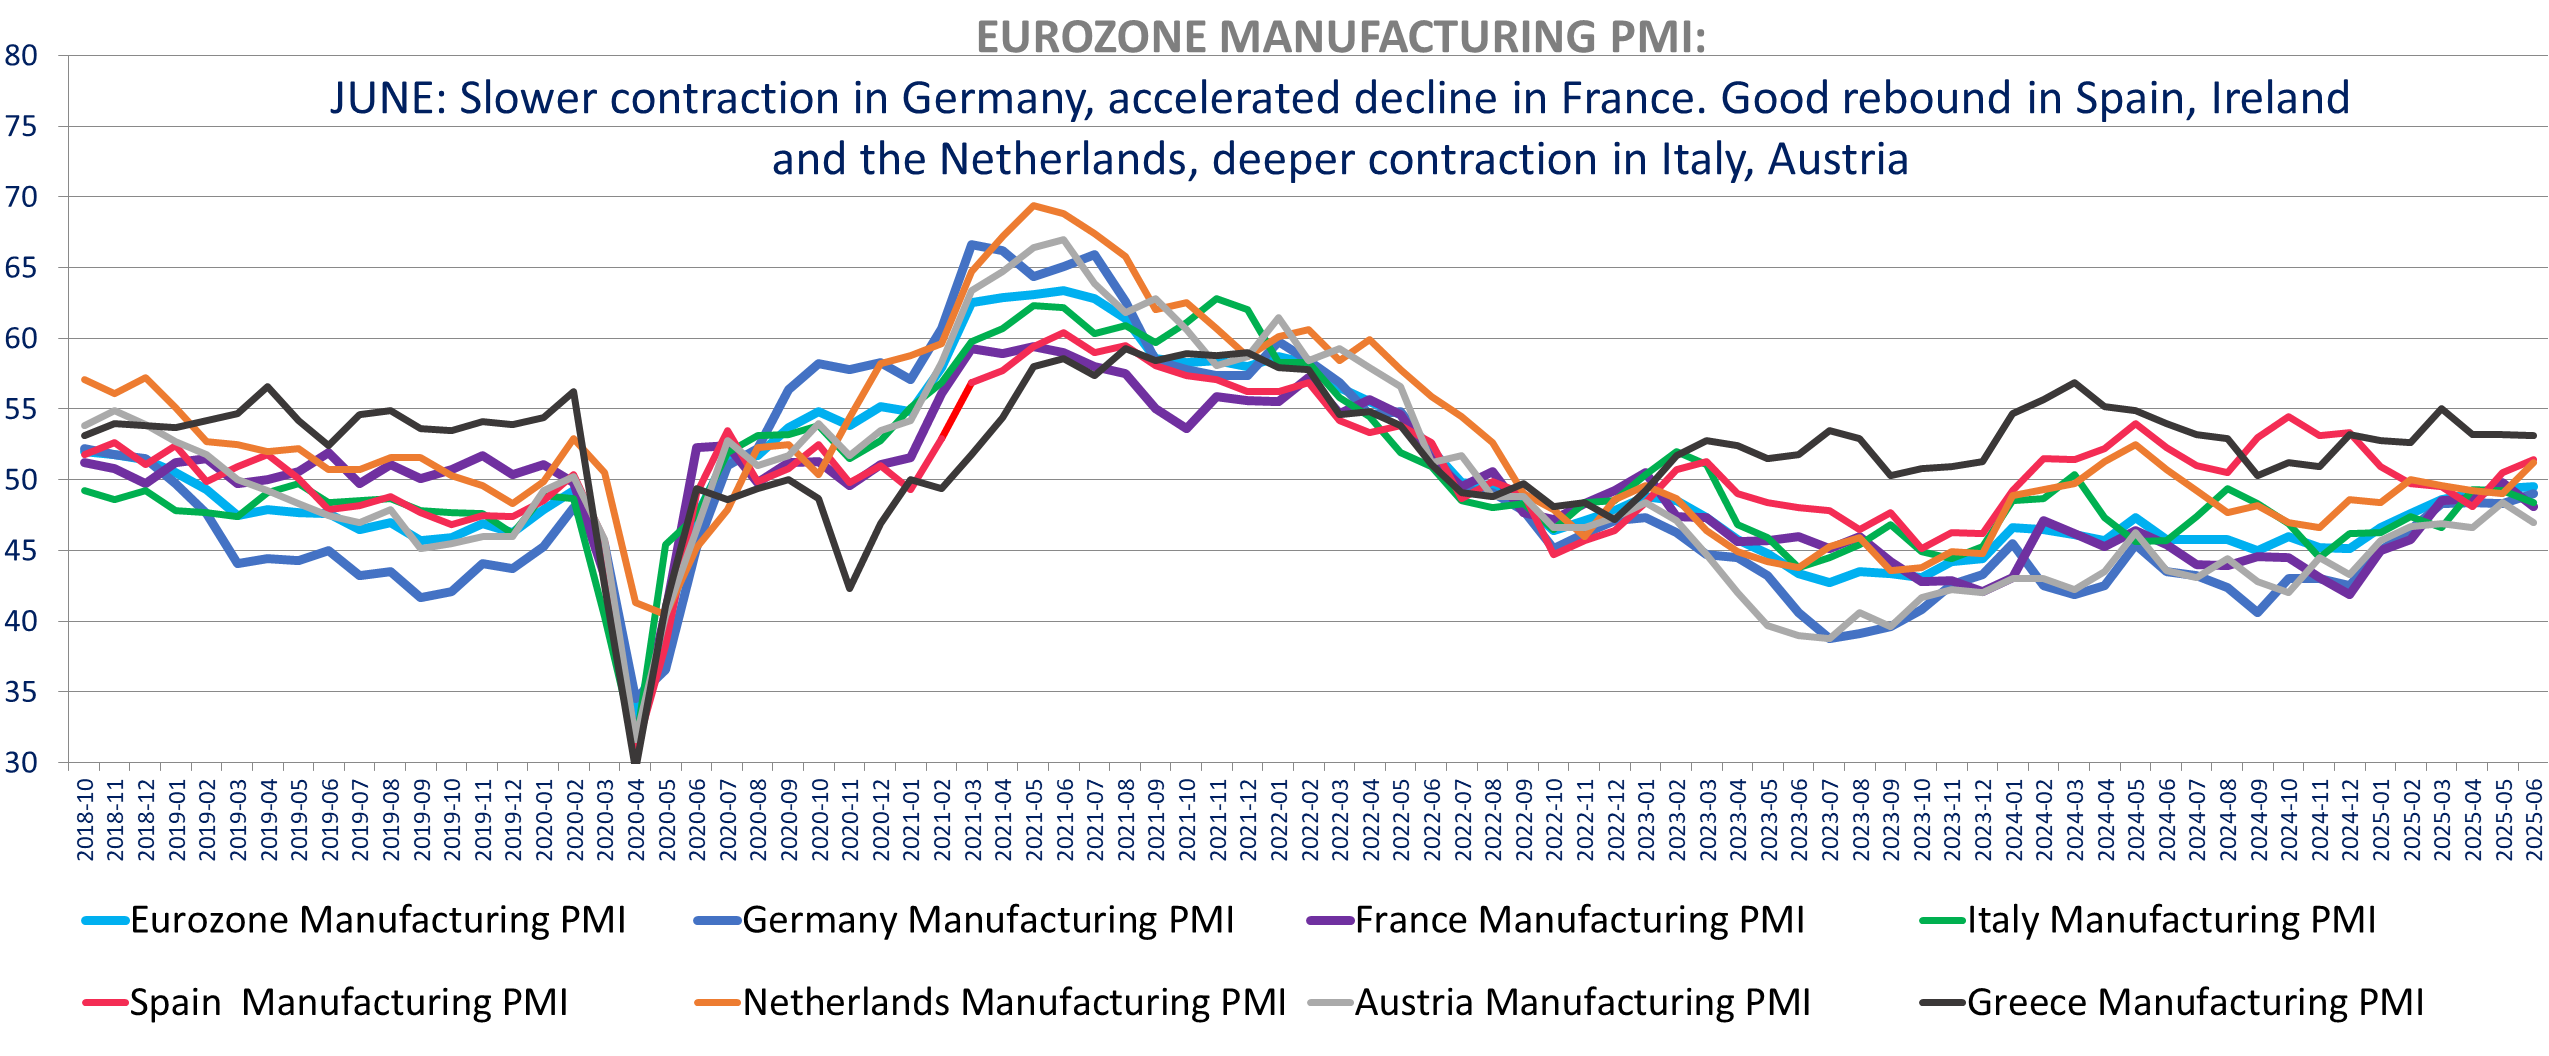
The Eurozone PMI manufacturing are also revised slightly higher (Eurozone , France) and confirmed at a 34month high in Germany. We see as sharp rebound in Spain (above Expectation), the Netherlands and Ireland While Growth is steady in Greece. If it was not for weaker manufacturing in France (corroborated by the ESI and INSEE survey) and in Italy (PMI falling to 48.4 from 49.2 when expectations were for a slight increase to 49.5), manufacturing shows sign of stabilization in June with stable orders and slight production growth. Moreover, the PMI shows low inflationary pressure for goods. Input costs decreased for the 3rd successive months. Prices charges also declined marginally for the second month. Input costs increased in France but decline in Germany and Spain. Costs increased at slower pace in The Netherlands. Prices charged are down in France, Italy Germany and even Spain (second month), but still up in Holland albeit at a slower pace. Input and output prices inflation increased in Greece.
In the UK the Manufacturing is confirmed at 47.7 improving from Mat but still contracting at significant rate. Orders are down both domestic and foreign. Export orders have declined for 41 months in a row, pointing to lower demand from the US, Europe and China. UK producers reduced staff again (8th month) and backlogs are still down (38th month of decline) at a substantial rate. Purchasing activity is down and inventories are down for both input and finished goods. Contrary to the Eurozone, the UK continues to see higher input costs, up for the 18th consecutive month but down to the lowest inn 6months and prices charged but output price inflation is the lowest in 3 months.
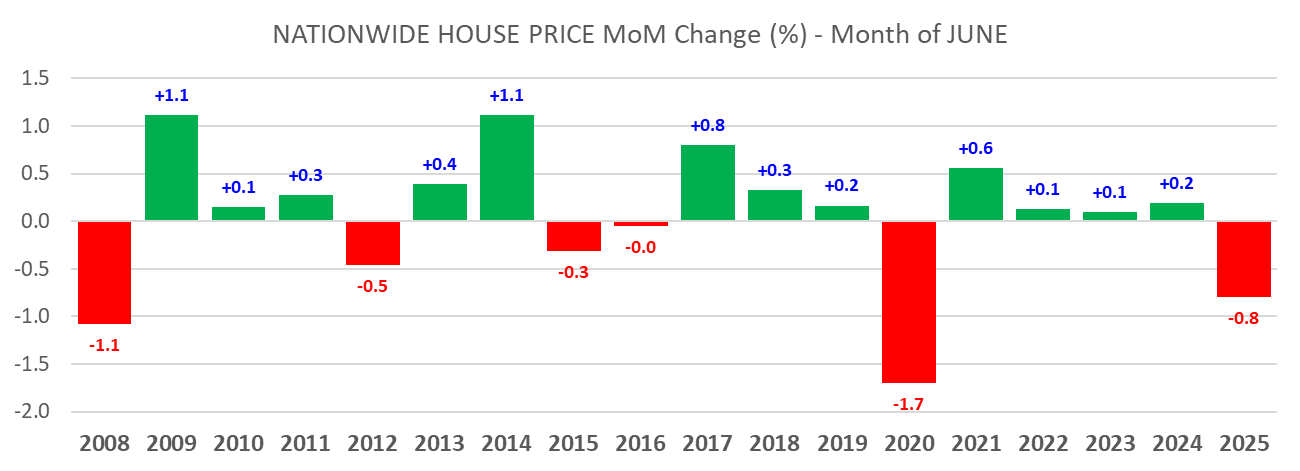
The June nationwide housing data is also disappointing with prices declining -0.8% m/m in June, the worst June on record since the GFC (June 2008) If on excludes covid
We see the BoE cutting in August
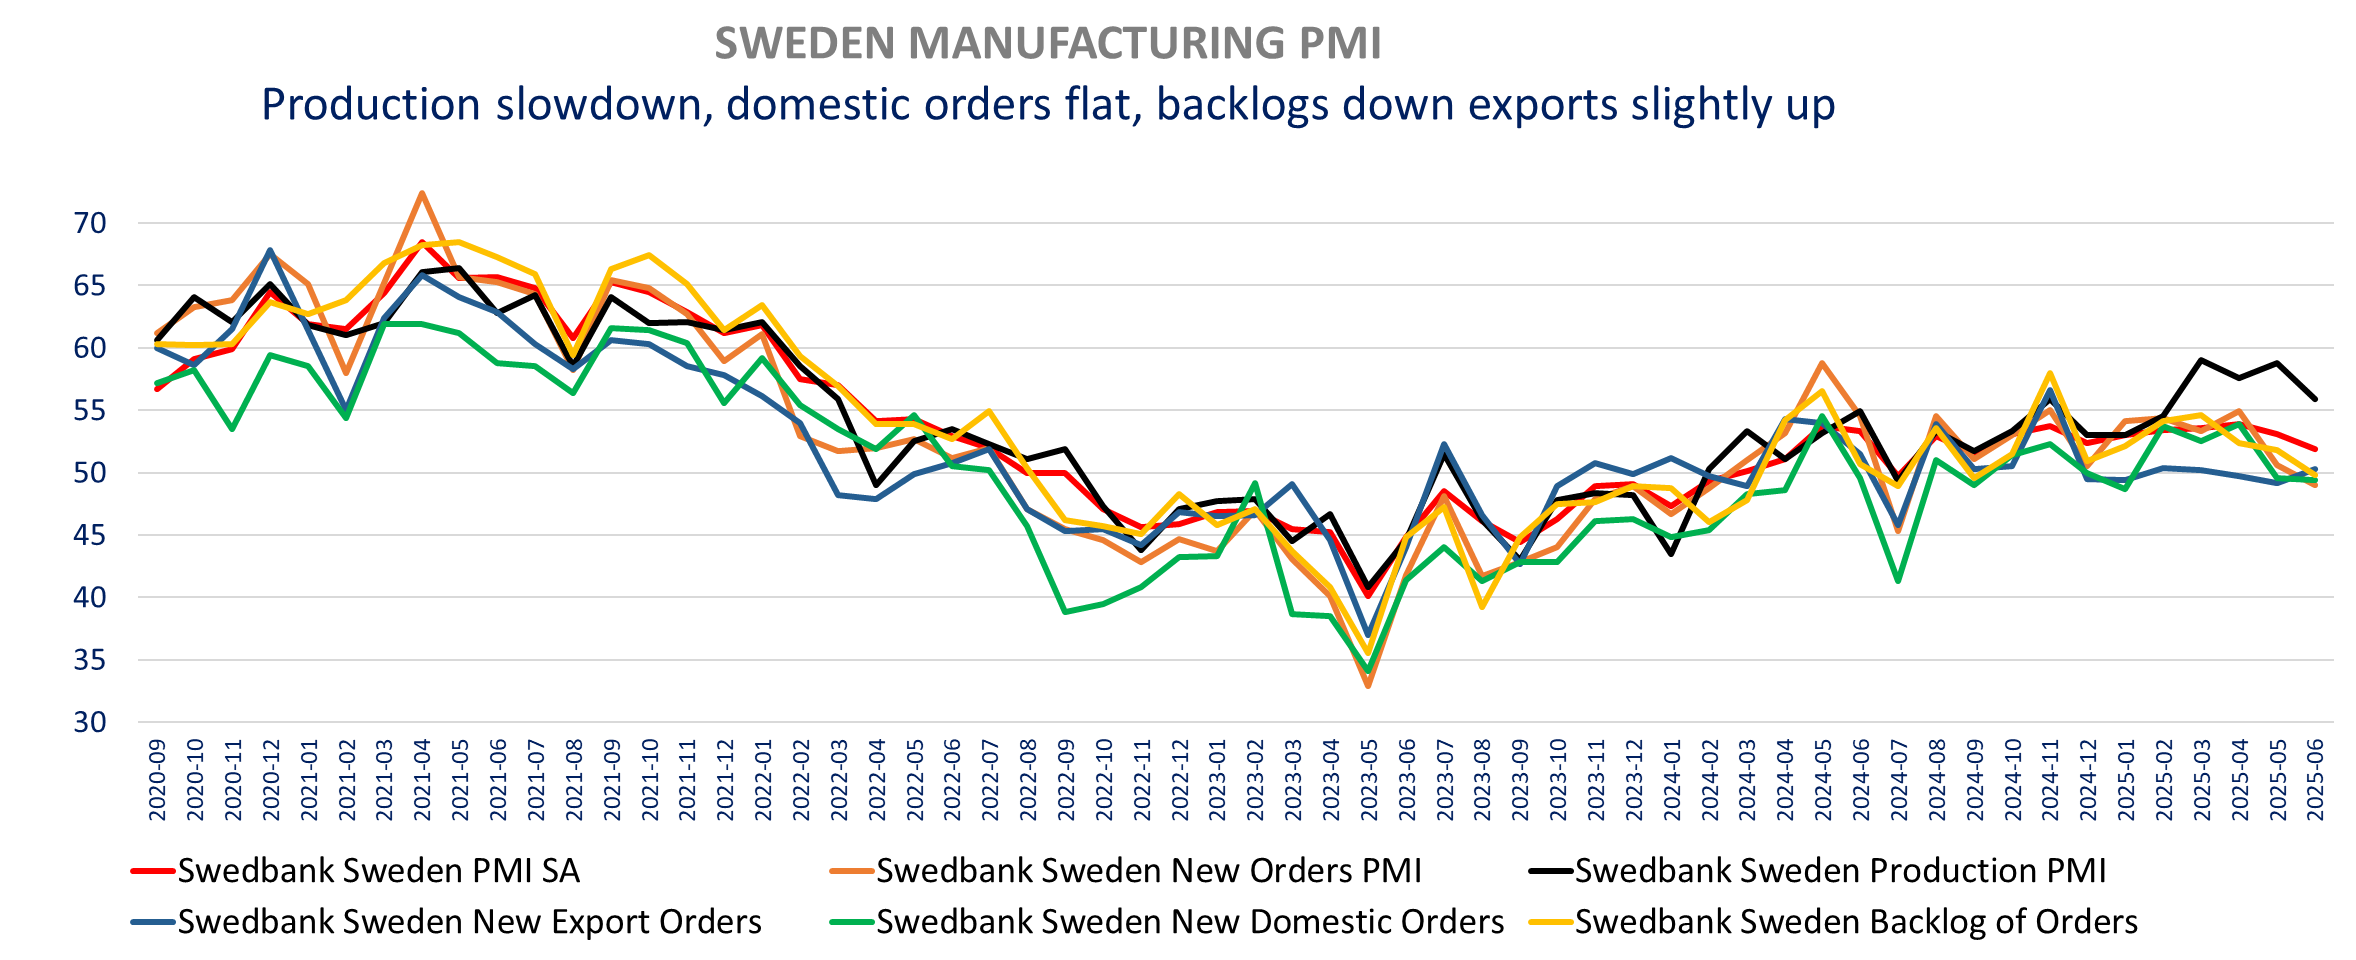
The Swedish manufacturing PMI was weak in June, with a significant growth slowdown, driven by weaker orders. It is the first decline in orders in 11 months (49 vs 50.6), dragged down by lower domestic demand while exports orders increased for the first time since March.
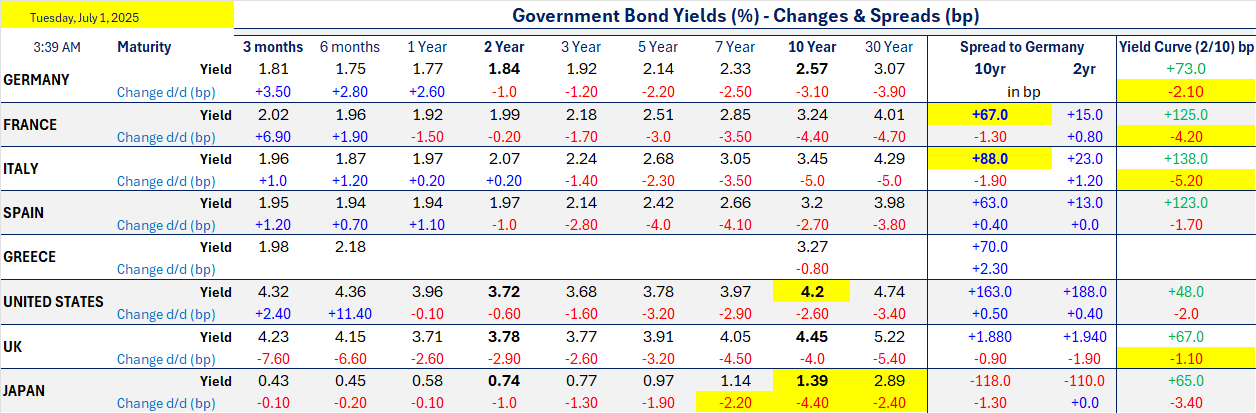
Bond yields are down and stocks weaker to start the second half. A lot of positives are priced in and hope for a positive reaction to the passage of now rather messy OBBB should be disappointed. Markets are also too positive on tariffs at this stage
On the companies’ front: Following a strong start in Q1 2025, performance continued to be very solid throughout the first half of the year in Umicore’s Catalysis Business Group. In this context, Umicore expects adjusted EBITDA for the full year 2025 to be in the range of €790 million to €840 million, this compares with the previous expectations of €720 million to €780 million and analysts' consensus of €800m. Renault Group has announced that its stake in Nissan, which until now has been accounted for using the equity method, will now be a financial asset measured at fair value through equity (estimated based on Nissan's share price). The financial impact, which is non-cash and has no impact on the calculation of the dividend paid by Renault, is estimated at a loss of €9.5bn, recognized in the income statement, mainly in other operating income and expenses as of 30 June. Sainsbury's UK like-for-like sales, excluding fuel, rose 4.7%, against a rise of 3.7% in the previous quarter, as good weather drove spending across its food, clothing, and Argos general merchandise brand, beating a consensus forecast of 3.4%. No change in the 25/26 outlook. Sodexo Q3 sales were in line with the consensus following a profit warning in March. The US market still shows the weakest performance. Sodexo now expects full year revenue growth and margin to be close to the lower end of the updated guidance. More details on equities here
Wimbledon Start…. And Keir Starmer in trouble

EUROPEAN MANUFACTURING PMI RECAP

ECB CES SURVEY
The ECB May Consumer Expectations Survey (CES) shows further decline in inflation expectations. Slightly lower mortgage rates expectations and easier credit conditions over the next 12months. Income expectations are higher but spending expectations lower. Employment expectations are slightly better too.

Housing & Credit


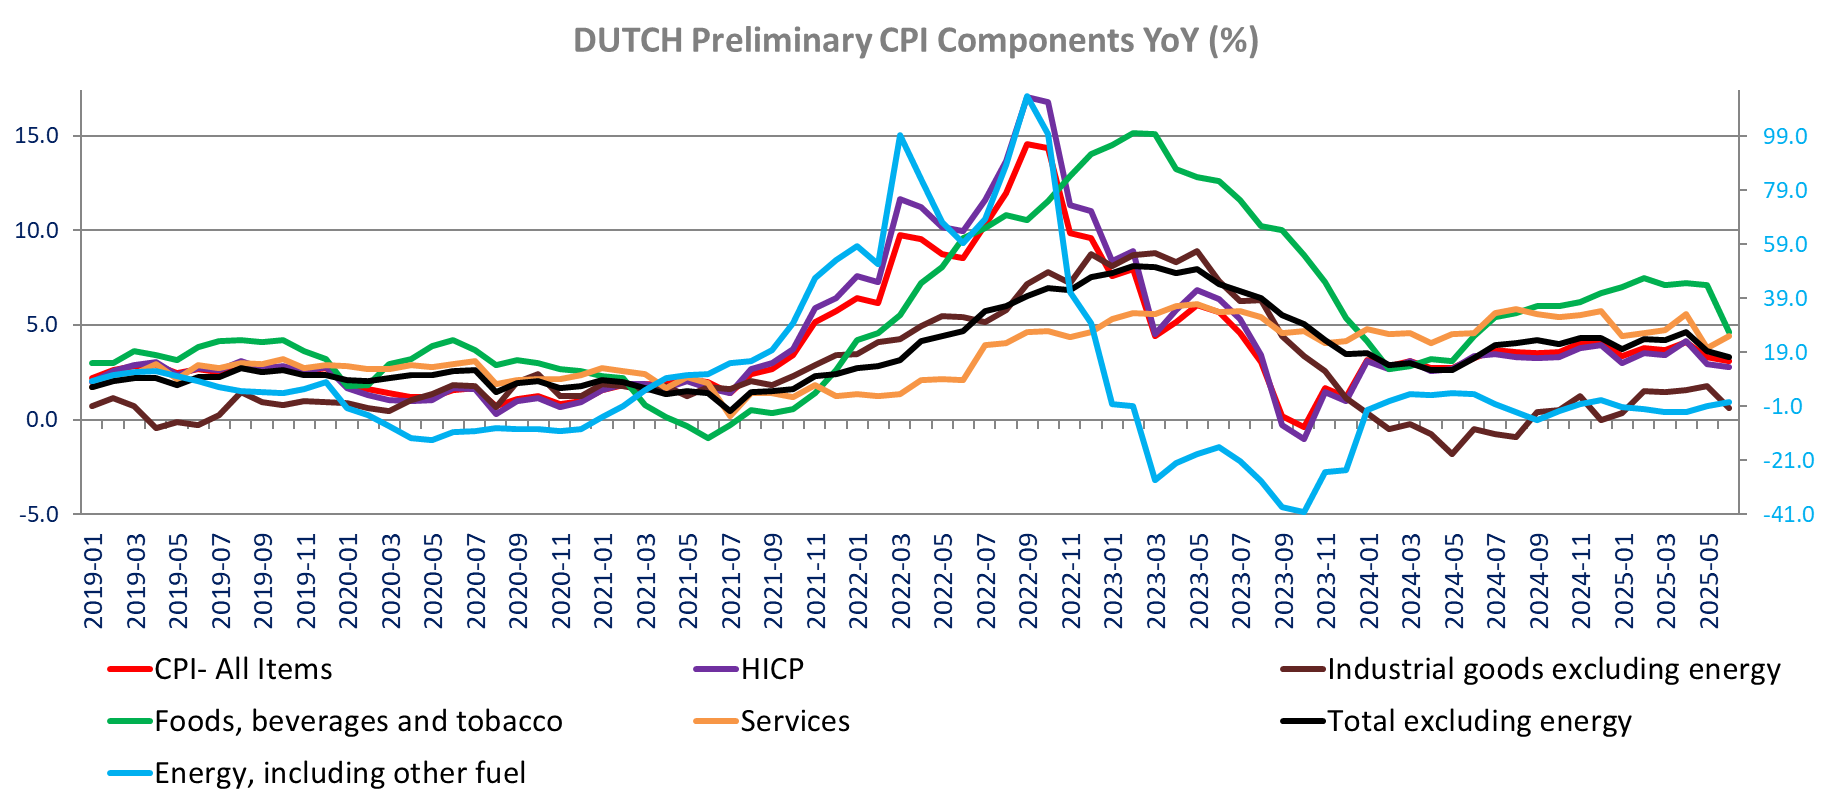
DUTCH CPI
The June Dutch inflation (Preliminary) is down to its lowest in One year at 3.1% toy with prices unchanged month-over-month, down from 3.3% yoy in May, better than expectations. The HICP prices are also flat m/m bringing the annual rate of harmonized inflation to 2.8% down from 2.9%, the lowest rate since May 2024.
The CPI excluding energy is down to 3,.3 % from 3.6%, also at a year low and energy inflation increased to 0.6% from -1.1% yoy in May.

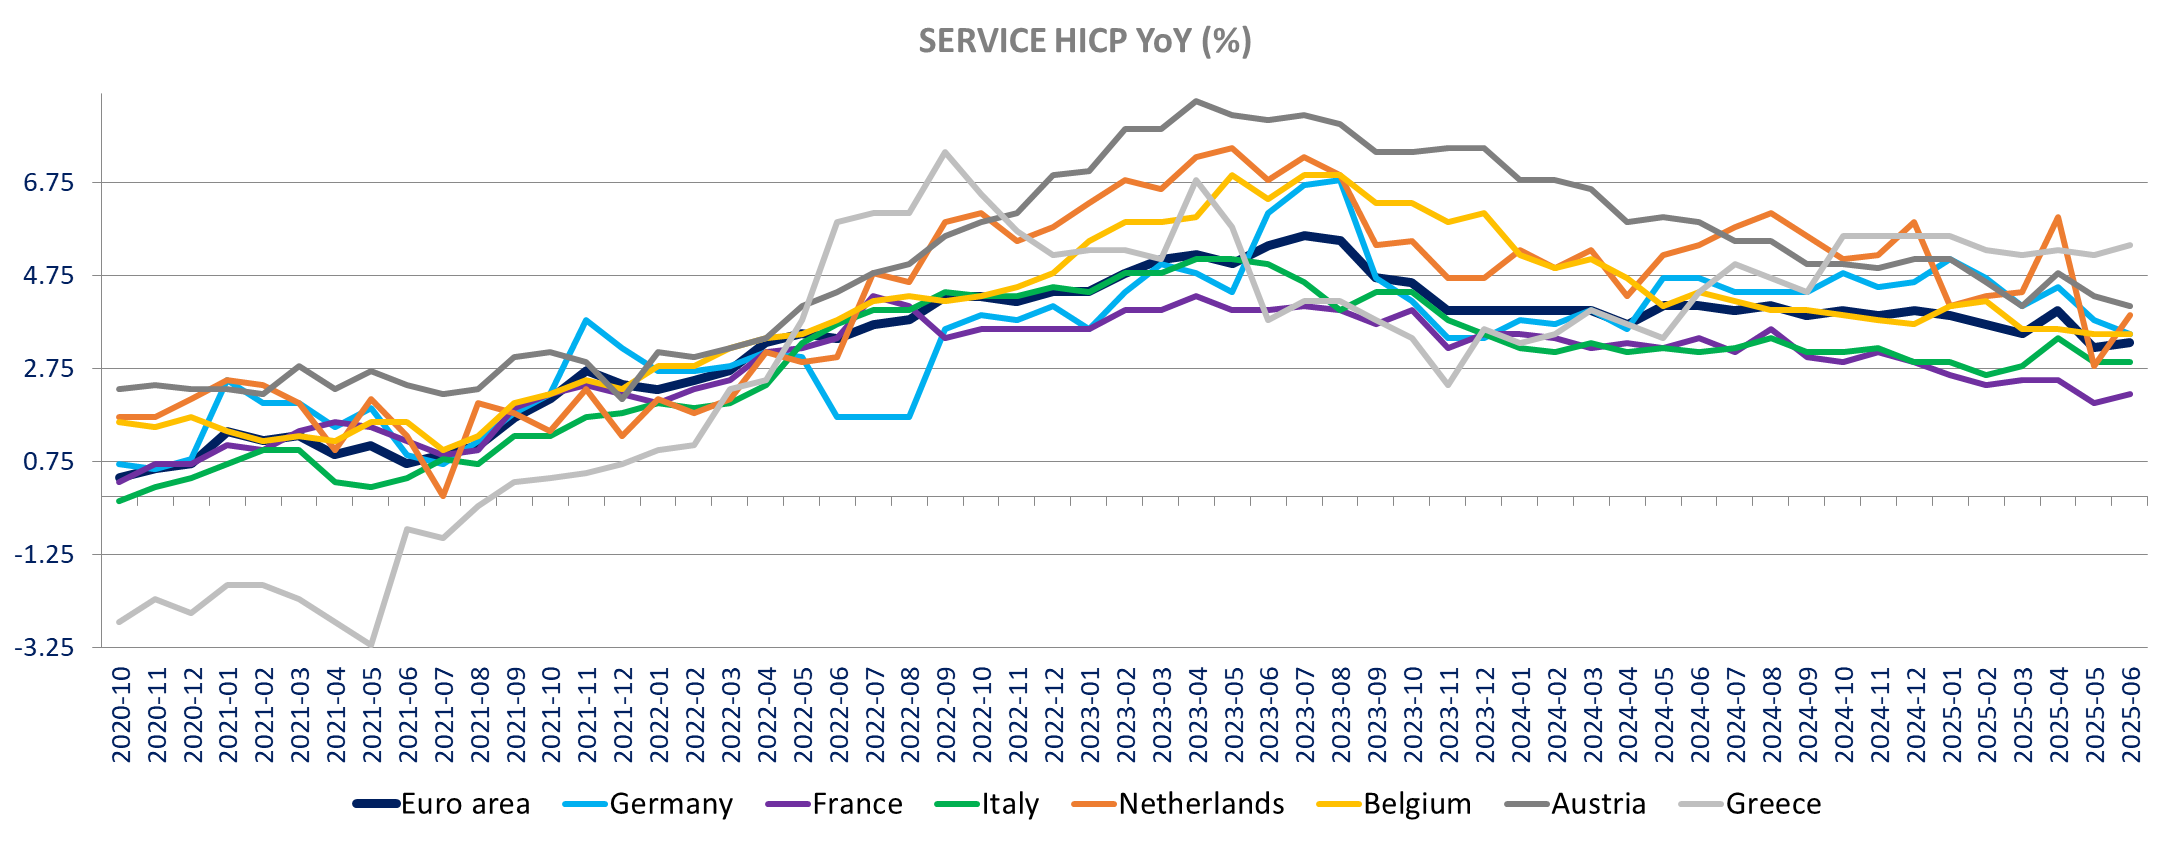
The Eurozone Preliminary inflation for June is in line with expectations up to 2% yoy from 1.9% in May (0.3% m/m). The core CPI is unchanged at 2.3% yoy (0.4% m/m). also in line, despite an increase in Services inflation to 3.3% from 3.2%, 0.7% m/m). Eurostat Release
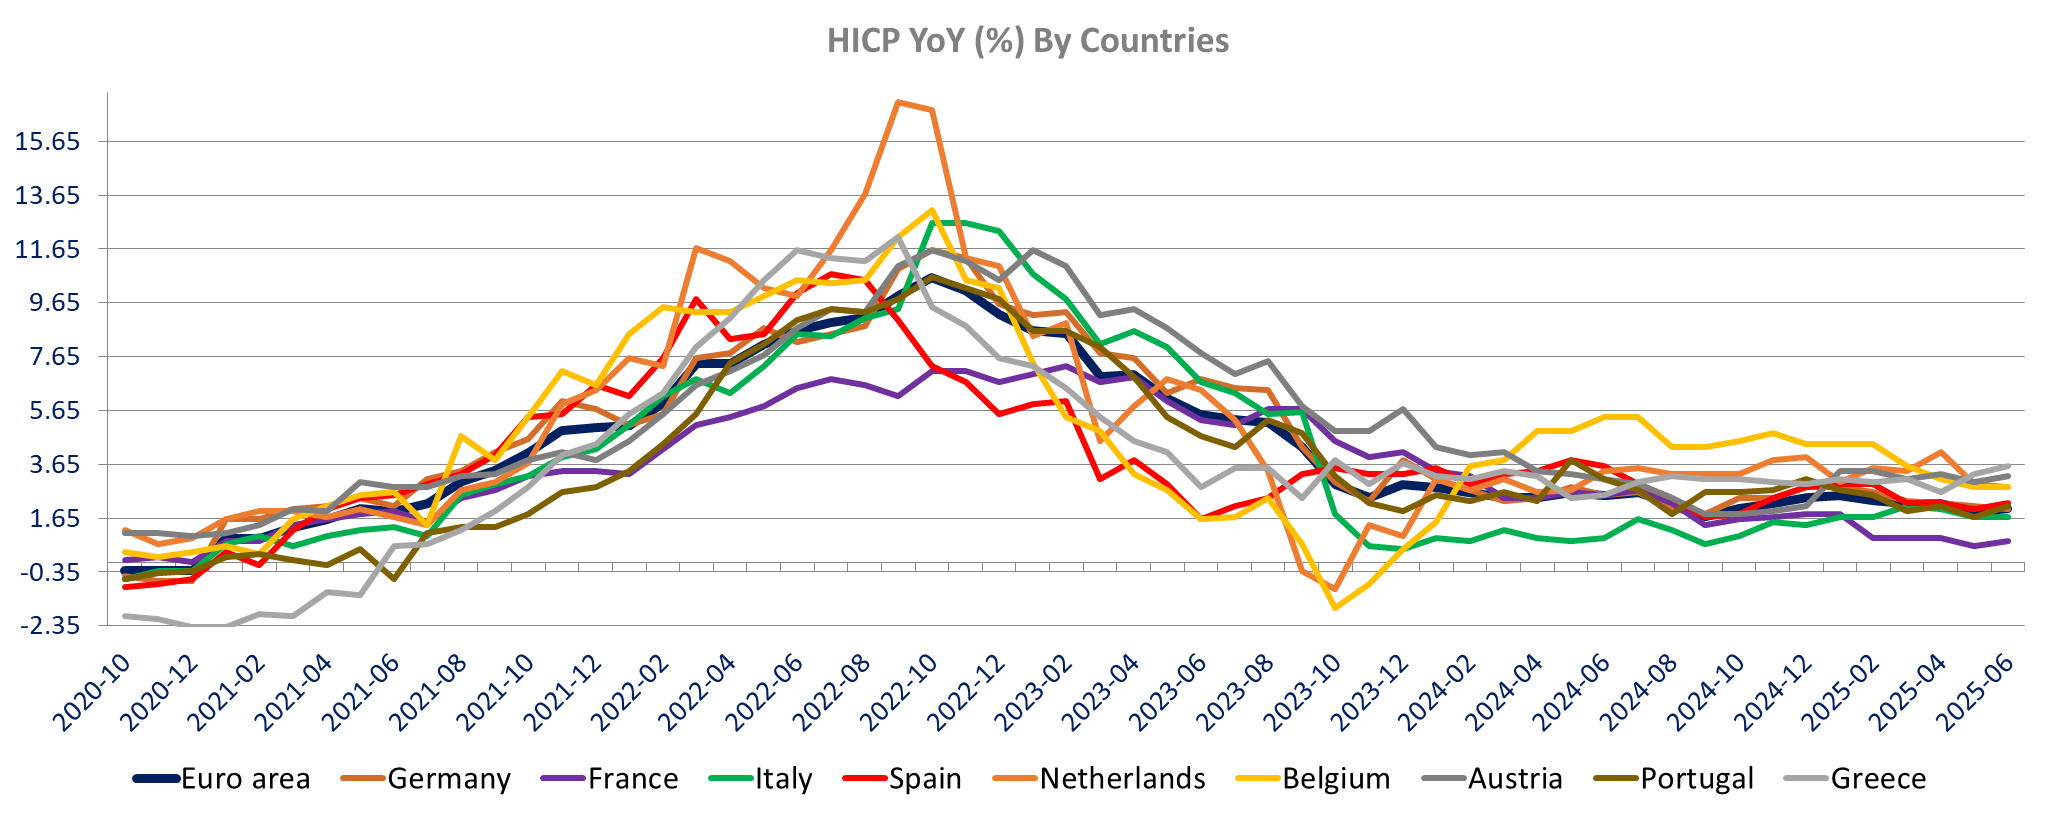
HICP Inflation is down in Germany at 2% vs 2.1%, Holland (2.8% vs 2.9%), and Finland (1.9% vs 2%), it is unchanged in Italy at 1.7% but up in all the other countries reported.
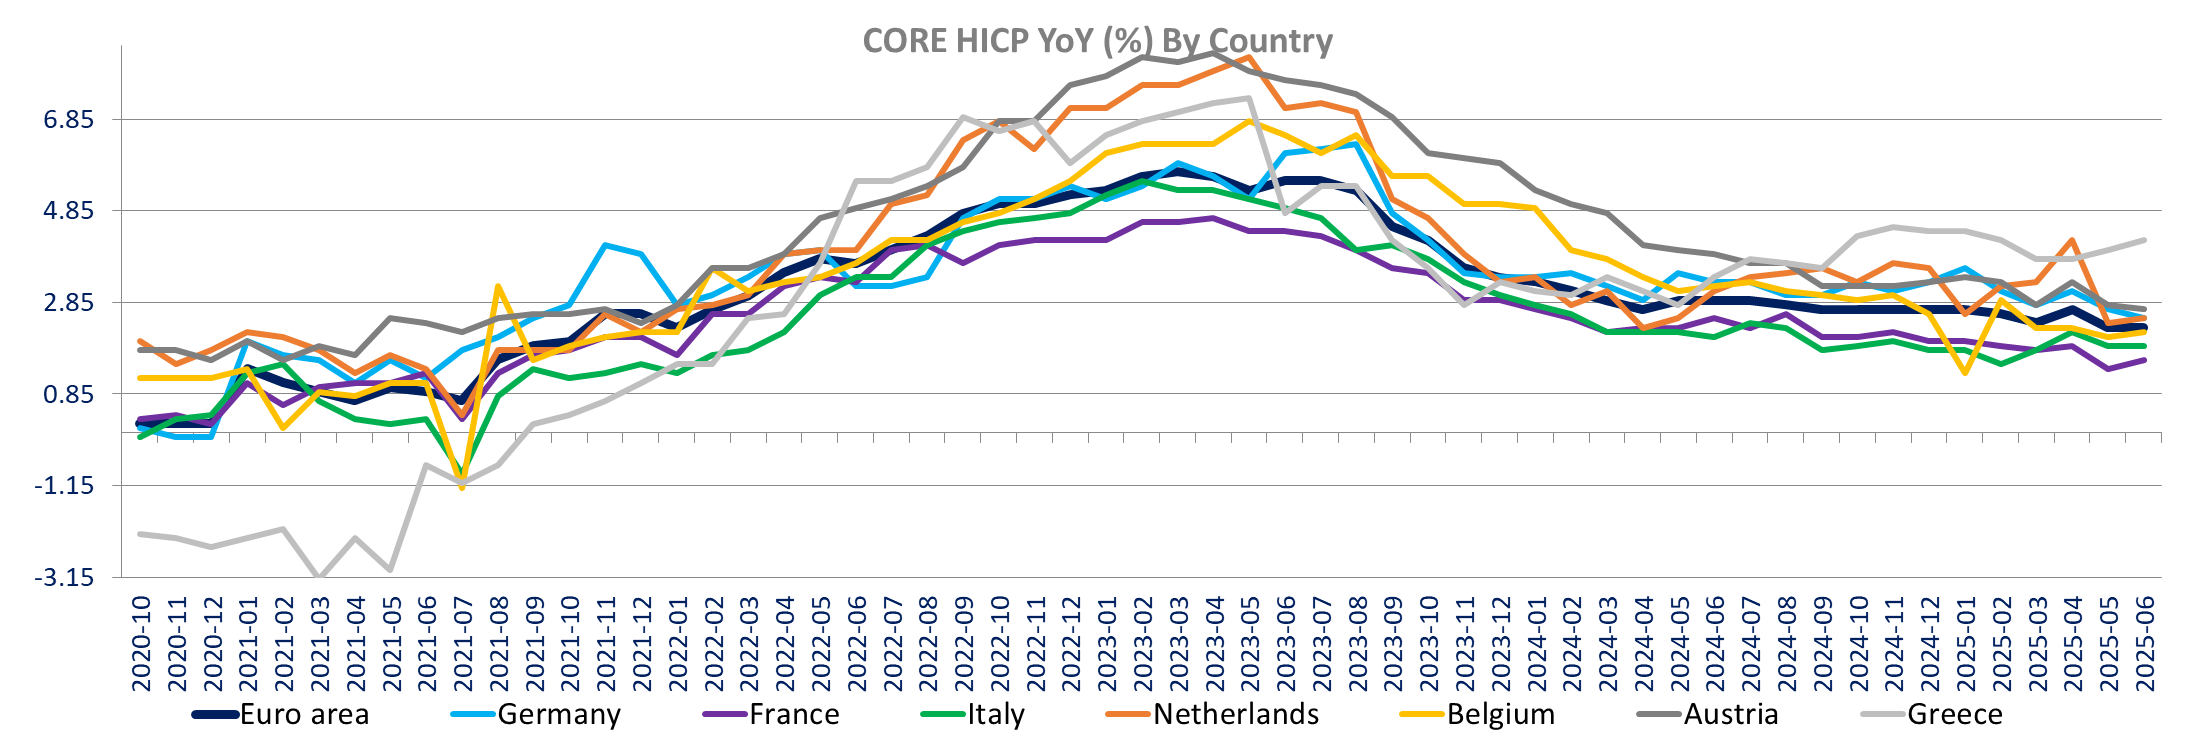
Core inflation is down in Germany and Croatia, unchanged in Italy and Finland, but up in France, The Netherlands, Belgium and Greece.
Services inflation is down in Germany, Austria, Finland and Croatia, unchanged in Italy and up in the other countries


Energy

Non-energy industrial goods

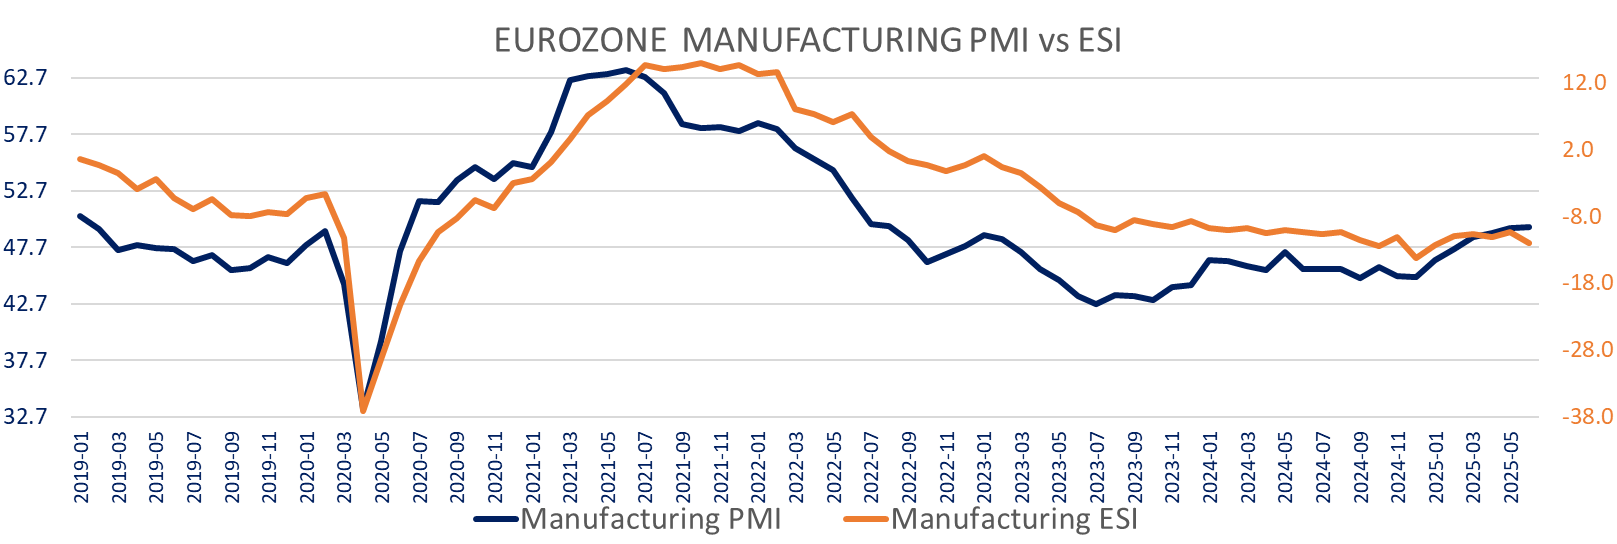
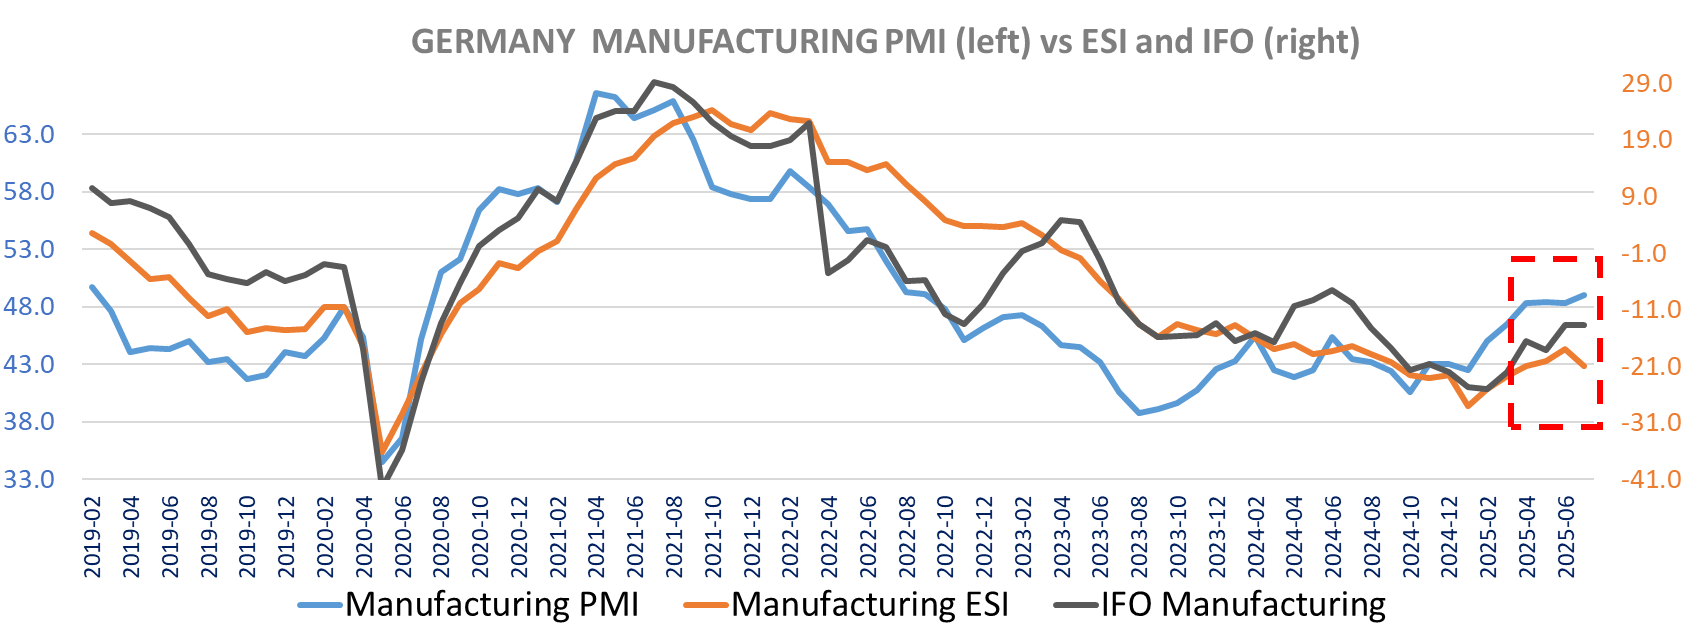
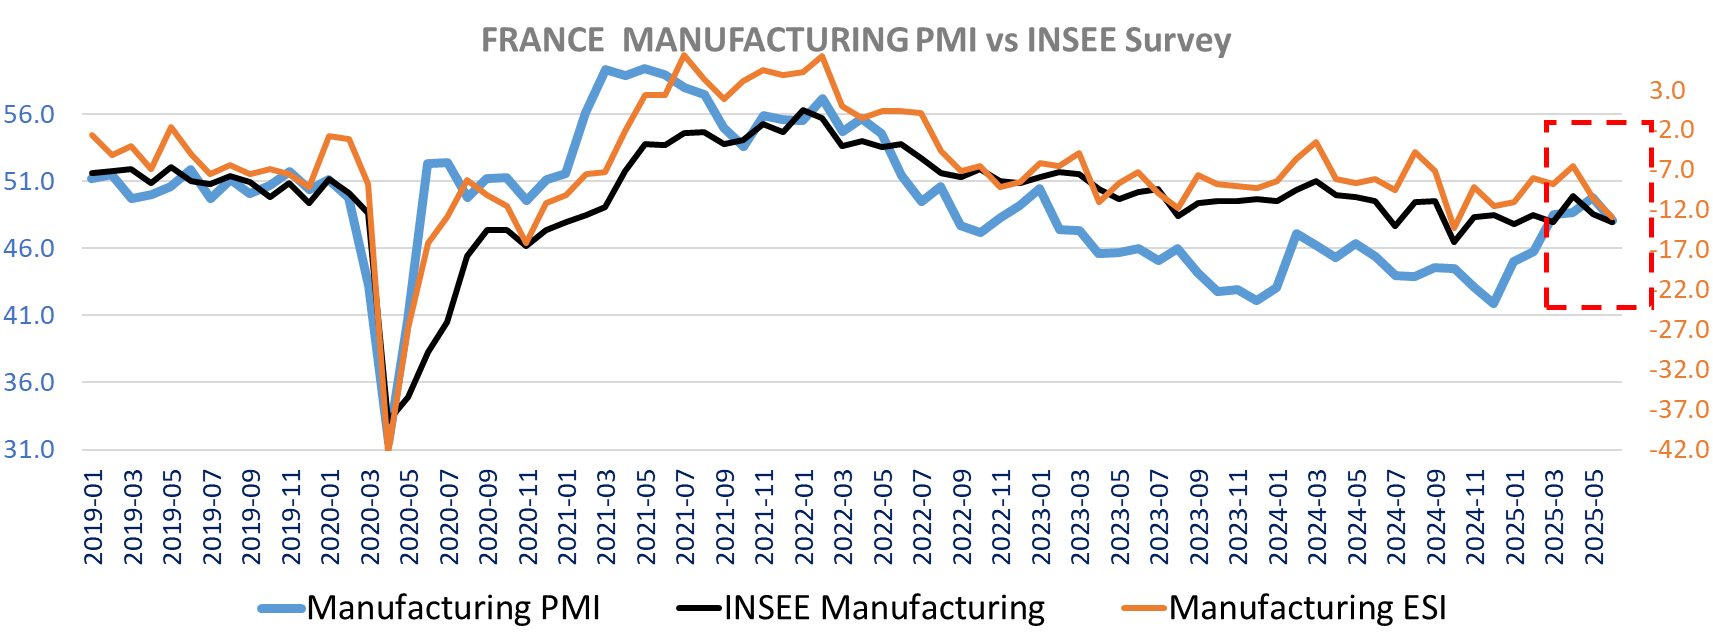
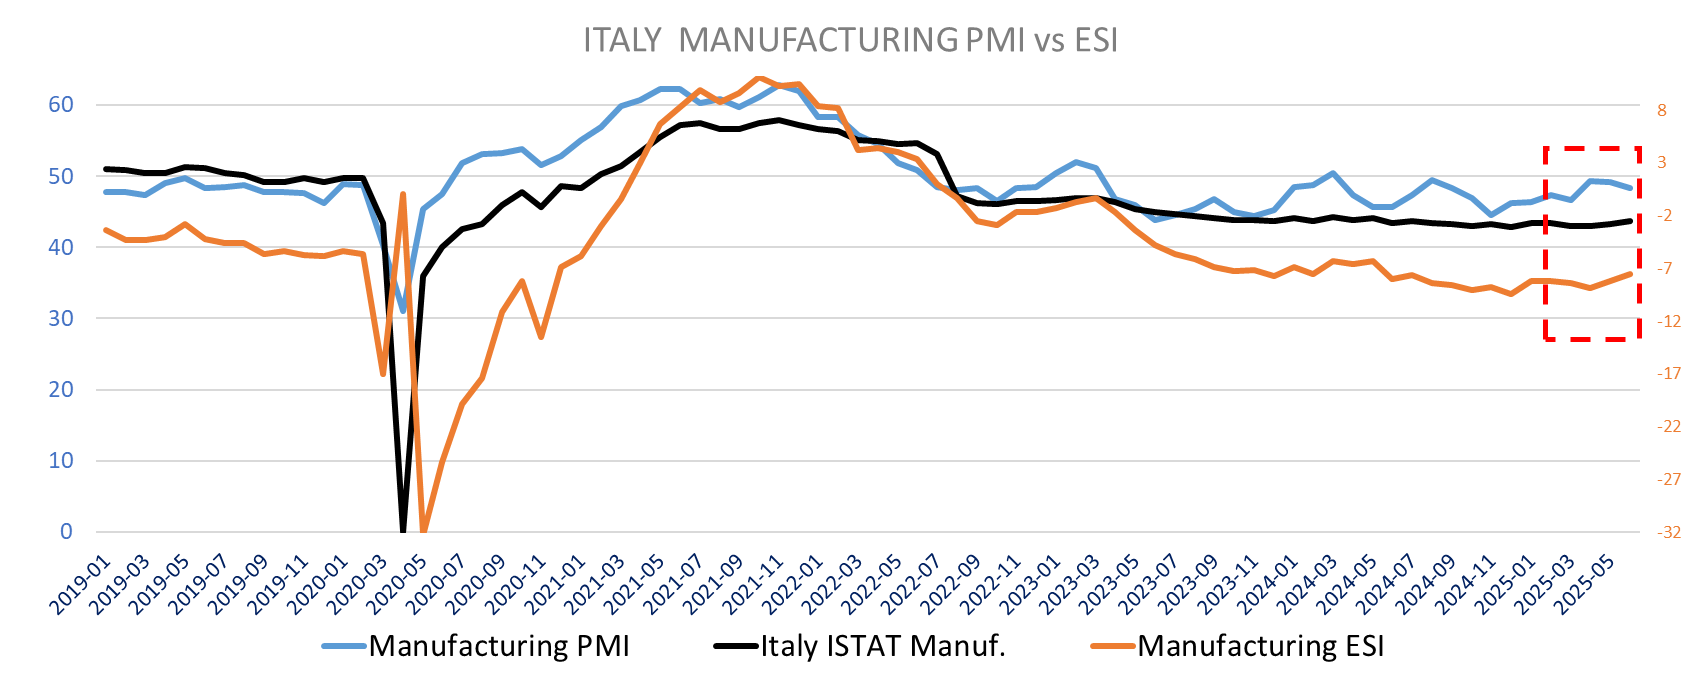
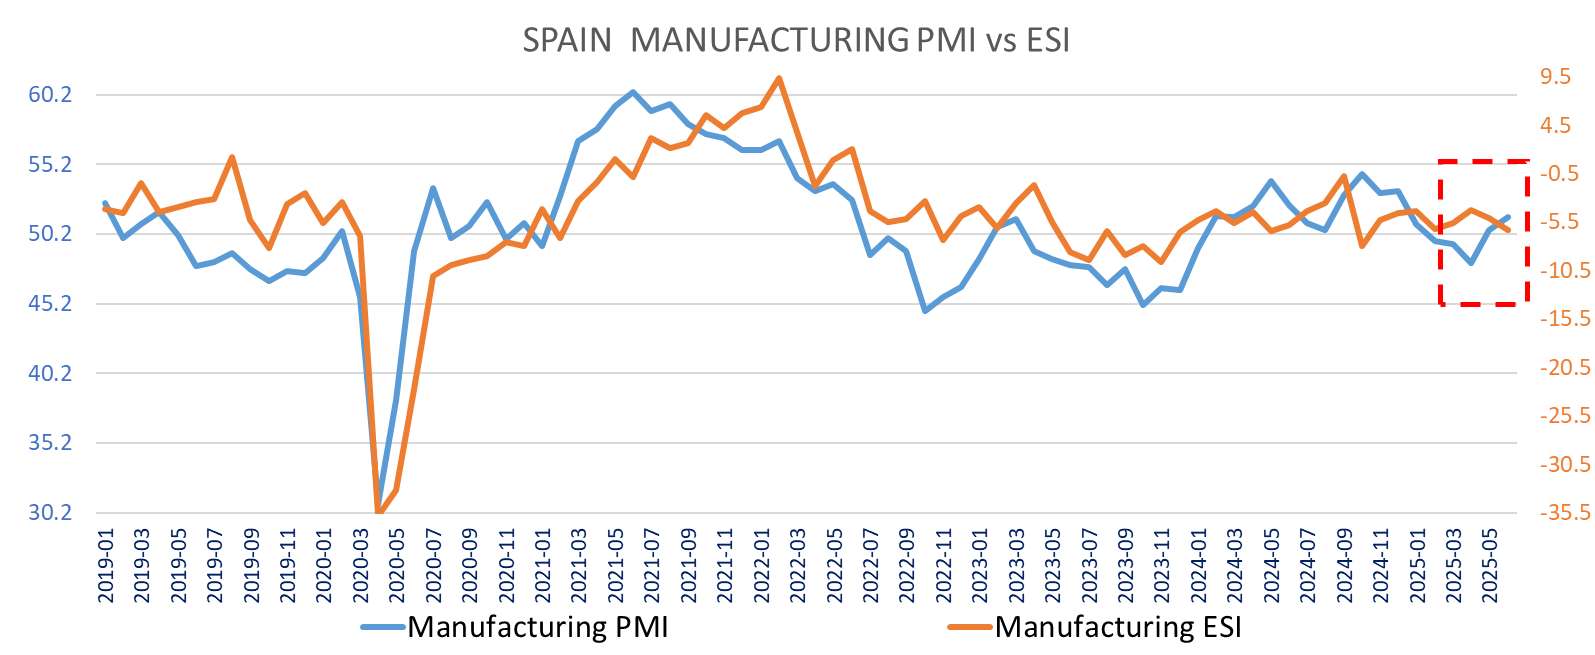
The Eurozone Manufacturing PMI is revised marginally up in June to 49.5 from 49.5, still the highest in 34 months (August 2022). German manufacturing is confirmed up at 49 (48.3 in May) while France June manufacturing PMI is revised up to 48.1 from 47.8, remaining at 4 months low and the main drag for manufacturing within the Eurozone with Italy. Spain surprised on the upside with a good rebound in manufacturing activity with the June PMI at 51.4 from 50.5 above consensus of an unchanged PMI. On the other hand, Italy disappoints with the PMI falling to 48.4 from 49.2 when expectations were for a slight increase to 49.5. The Spanish PMI is now at a 6-month high and the Italian at 3 months low. We also see a sharp rebound in the Netherlands with the PMI at the highest in 13 months at 51.2 increasing from 49, above 50 for the first time in a year. Ireland also a sharp bounce in activity at a 37-month high. Austria manufacturing contracted at a faster pace and Greece manufacturing maintained steady growth (53.1 vs 53.2). The Flash PMI did point to improvement in Manufacturing in the rest of the Eurozone (ex-Germany and ex-France). As noted earlier, the ESI Manufacturing was more negative than the in June, down in Germany France, Spain and the Netherlands.
Eurozone HCOB manufacturing PMI

Other links to release HCOB German Manufacturing PMI, HCOB France Manufacturing PMI, HCOB Italy Manufacturing PMI, HCOB Spain Manufacturing PMI, Nevi Netherlands Manufacturing PMI, S&P Global Greece Manufacturing PMI
Comparison to ESI and domestic Data
The ESI was clearly more negative for Germany than the PMI or IFO manufacturing
The ESI, PMI and INSEE all pointing south in June
For Italy the ESI manufacturing was up as was ISTAT, moving the opposite direction than the PMI
In Spain the ESI was slightly down not corroborating the sharp increase in PMI, but the ESI was up when the PMI fell earlier.
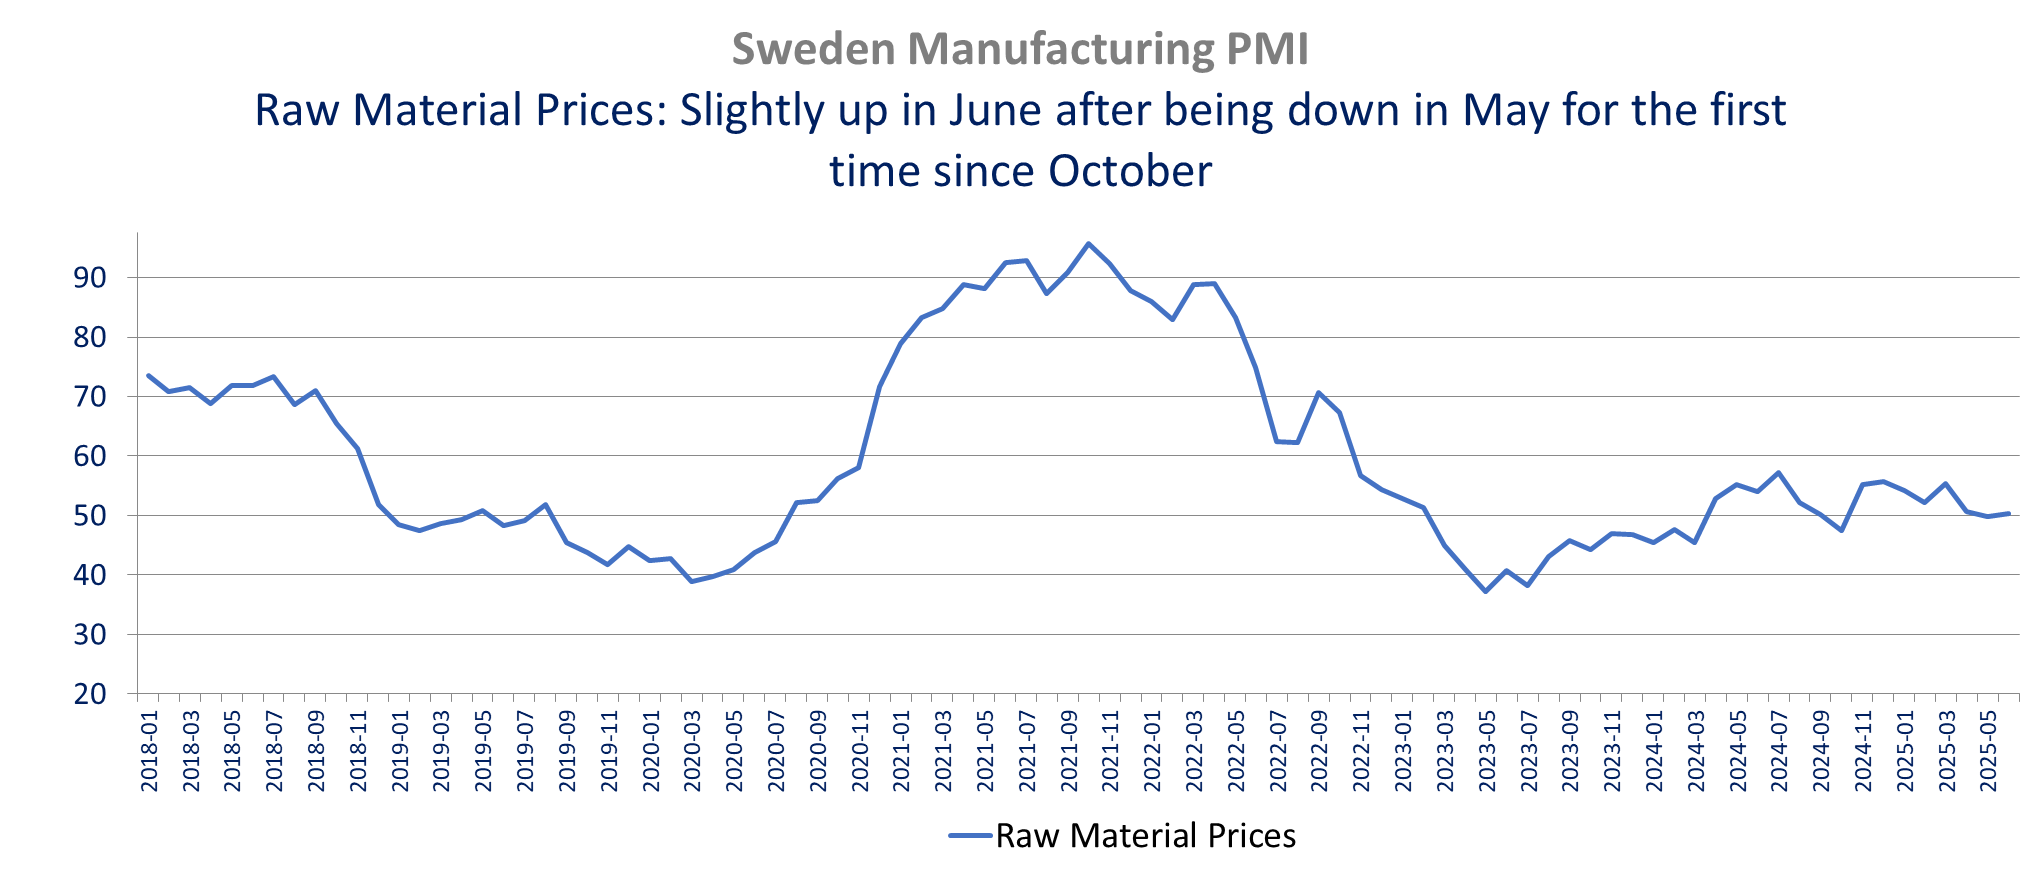
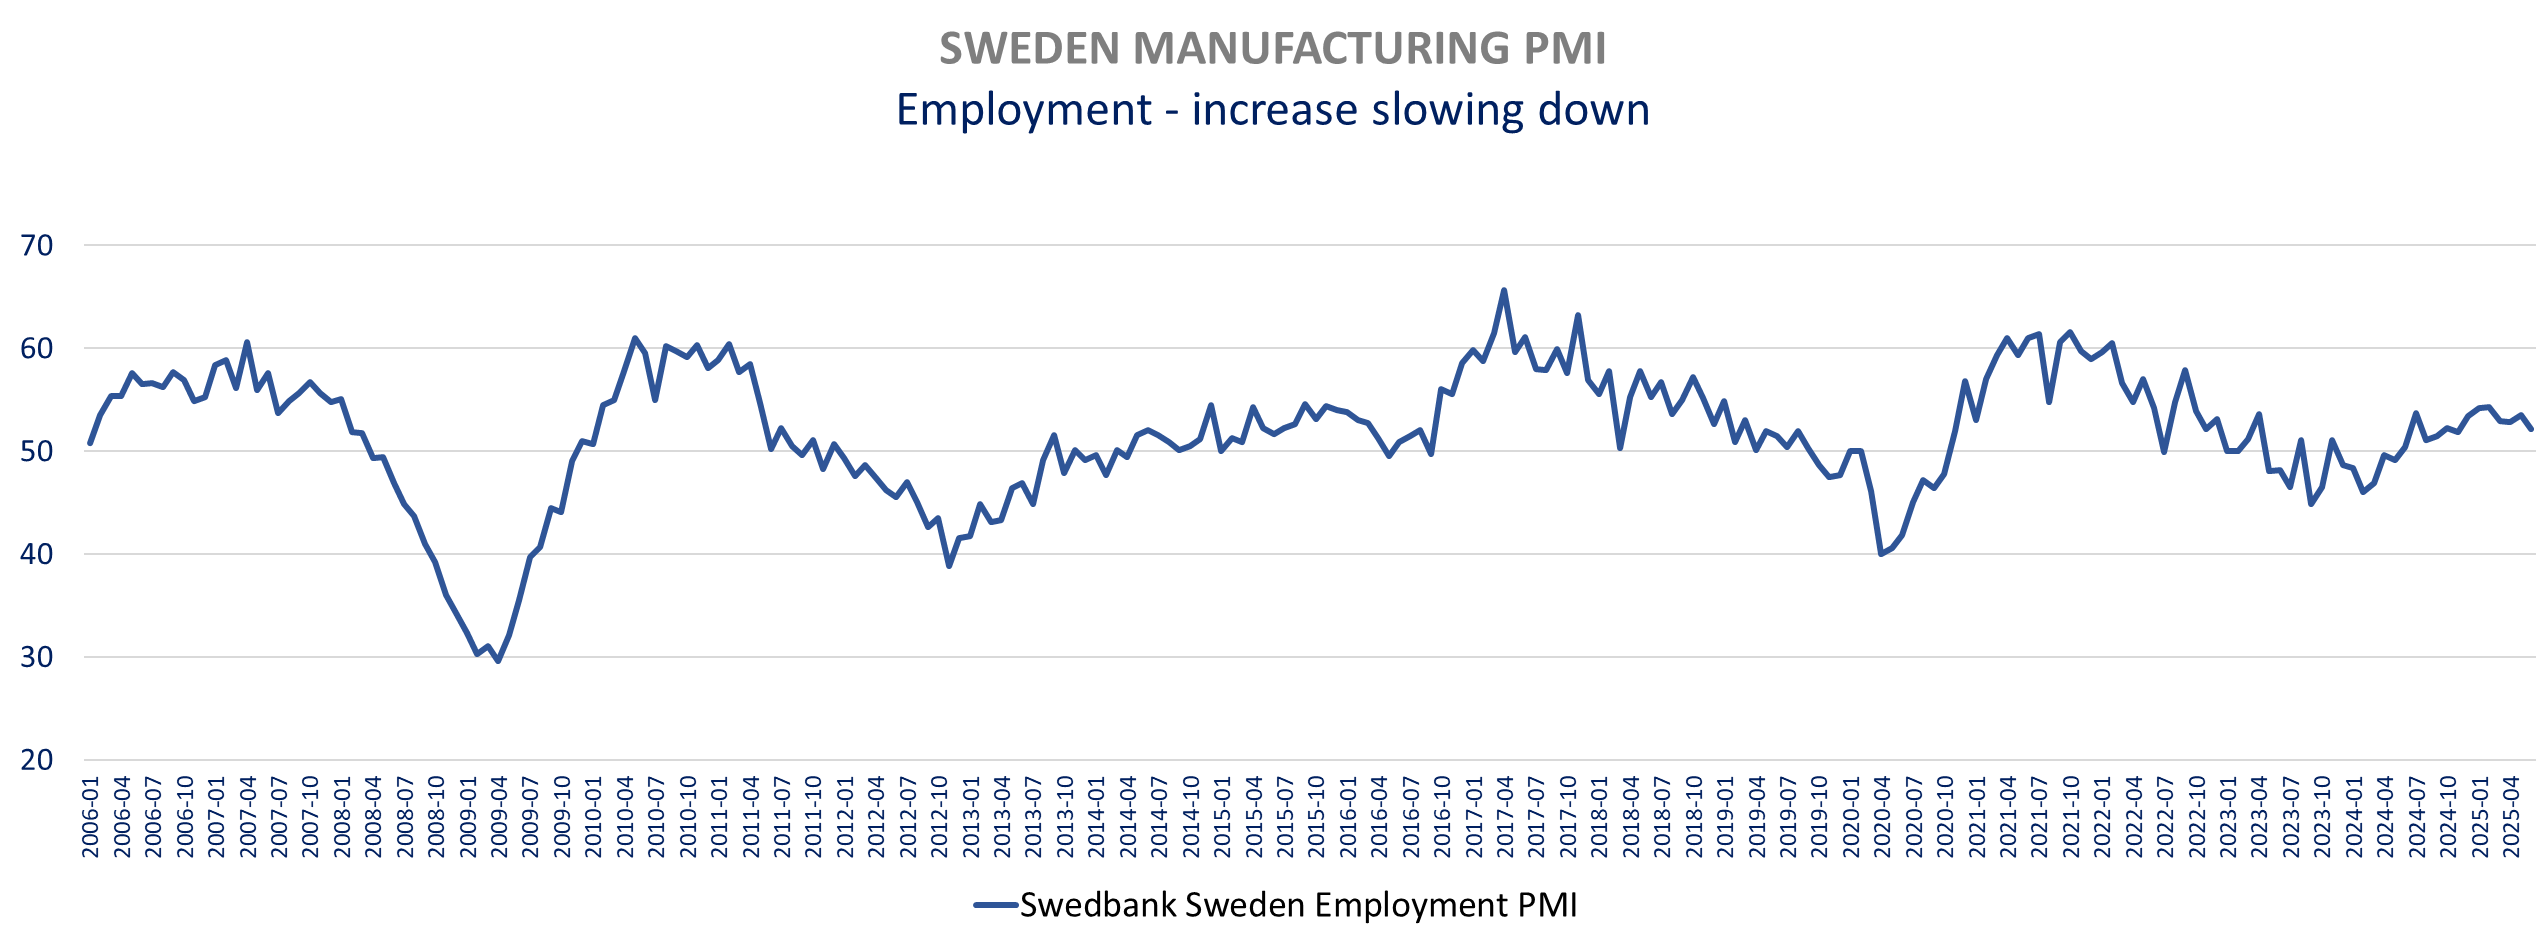
Weak Sweden PMI in June, weakest since September at 51.9 down from 53.1, below expectations of 52.7, amid slower production (55.9 vs 58.8) and the first decline in orders since in 11 months (49 vs 50.6), dragged down by lower domestic demand while exports orders increased for the first time since March. Employment increased again but at the slowest pace since November while backlogs declined marginally. Delivery times increased slightly (50.3 vs 50.9 in May). Input costs increased again in June after the slight decrease in May (50.3 vs 49.8). Planned production at 62.6 is down to the lowest since November.

The UK final Manufacturing PMI is confirming the Flash PMI at 47.7, up from 46.4 in May and highest in 5 months. Production declined for the 8th consecutive month. New orders decreased from both the domestic and the international sides. Export orders have declined for 41 months in a row, pointing to lower demand from the US, Europe and China. UK producers reduced staff again (8th month) and backlogs are still down (38th month of decline) at a substantial rate. Purchasing activity is down and inventories are down for both input and finished goods. Contrary to the Eurozone, the UK continues to see higher input costs, up for the 18th consecutive month but down to the lowest inn 6months.
“Higher input prices were linked to supplier price rises (often to offset increased labor costs), general inflationary pressures, shipping disruption and heightened geopolitical tensions. Chemicals, electronics, energy, food products, metals, packaging and timber were all reported as up in price.”
Prices charged are also up but only partially passing on the higher costs. Output price inflation is the lowest in 3 months.
Optimism is up in June” 46% see higher production and 10% see a decline.

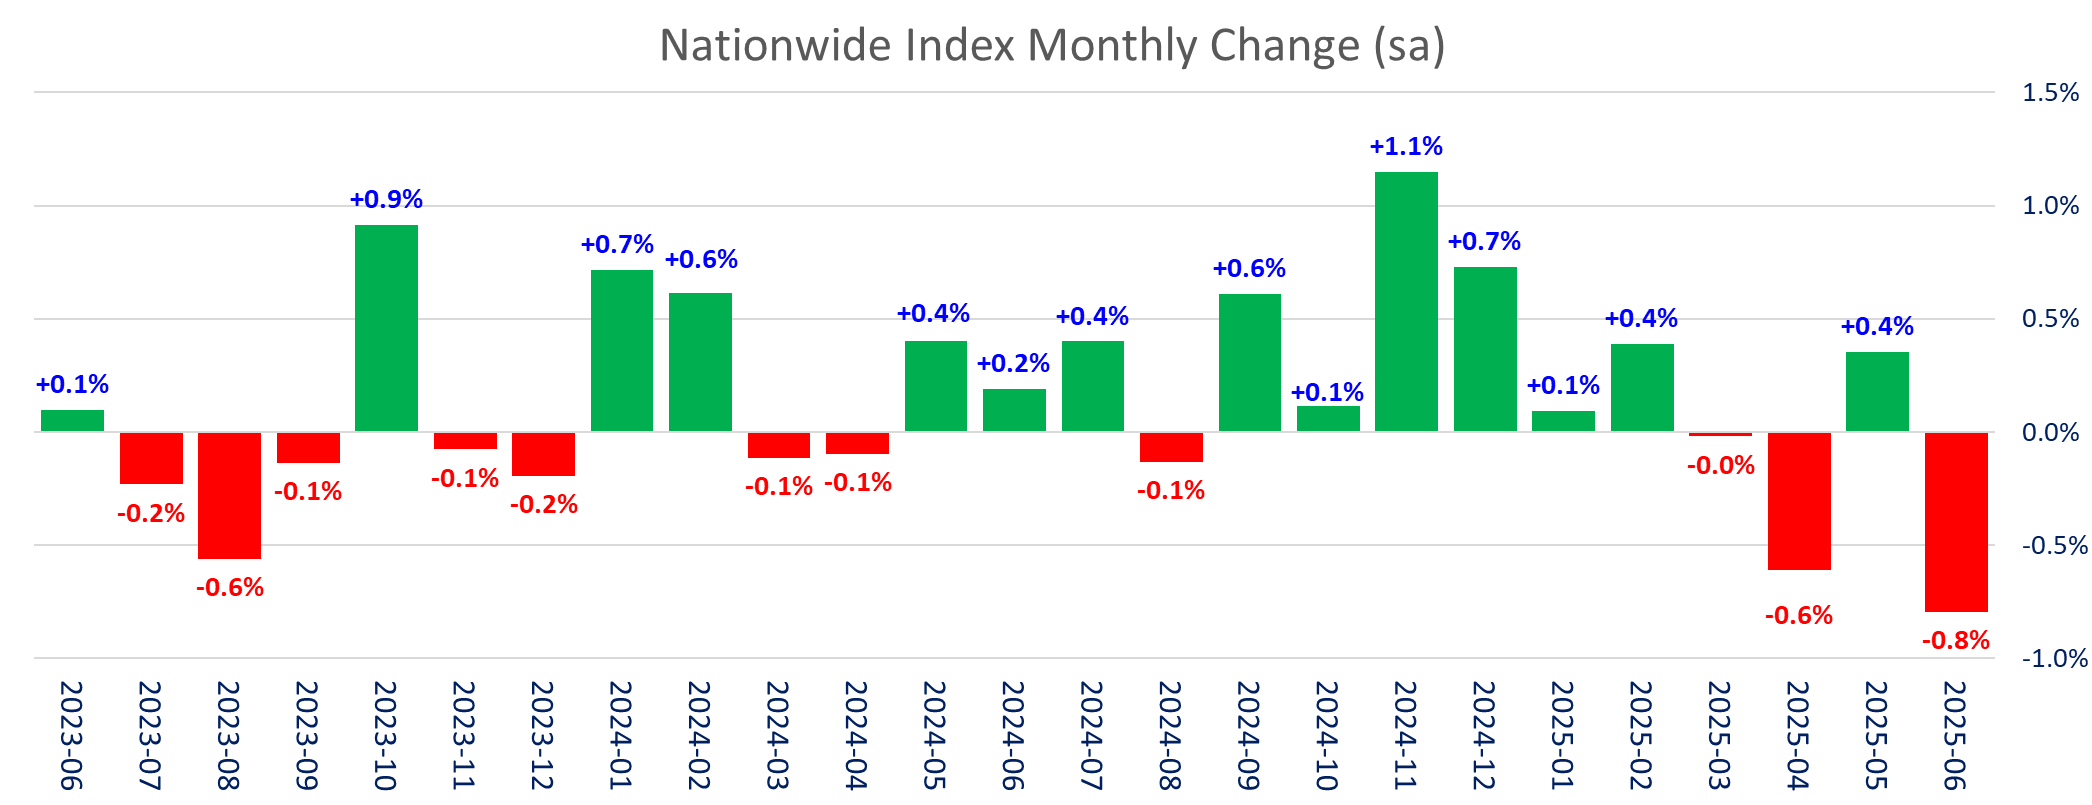
The UK housing market is weakening in June, post the increase in stamp duty in April, according to Nationwide. The Nationwide price index (sa) declined -0.8% m/m in June, the third weakest June since the GFC (-1.7% in June 2020 and -1.1% in June 2008). Average house prices (nsa) are down to £271,619 (-0.7% m/m) and are now up only 2.1% yoy down from 3.5% yoy in May.

|
|
Tuesday, July 1, 2025 | ||
|
UMI | |||
|
EUR |
13.84 |
+10.90% | |
|
UMI |
Guidance upgrade: Following a strong start in Q1 2025, performance continued to be very solid throughout the first half of the year. In this context and based on the information available to date, Umicore expects H1 Group adjusted EBITDA to come in somewhat above €420 million. | ||
|
|
|
|
|
|
RNO | |||
|
0 |
39.91 |
+1.99% | |
|
RNO |
Evolution of the accounting treatment of Renault Group's stake in Nissan. Renault Group's stake in Nissan, which was previously accounted for under the equity method, will be treated as a financial asset measured at fair value through equity, estimated on the basis of Nissan's stock price, as of June 30, 2025. The implementation of this new accounting treatment, resulting from the recent changes in the terms and conditions for the exercise by Renault Group of its rights related to its stake in Nissan, will result in the recognition of a loss estimated at €9.5 billion1, which will be recognized in the income statement, mostly as “other operating income and expenses” at the date of the change, with no cash impact and no impact on the calculation of the dividend paid by Renault Group. | ||
|
|
|
|
|
|
SBRY | |||
|
DKK |
285.00 |
-1.66% | |
|
SBRY |
Q1 trading update. Sainsbury's UK like-for-like sales, excluding fuel, rose 4.7%, against a rise of 3.7% in the previous quarter, as good weather drove spending across its food, clothing and Argos general merchandise brand, beating a consensus forecast of 3.4%. No change in the 25/26 outlook. | ||
|
|
|
|
|
|
SW | |||
|
EUR |
51.20 |
-1.92% | |
|
SW |
Q3 consolidated revenues reached €6.1bn, up +0.8% year-on-year, including a negative currency impact of -2.1%, a net contribution from acquisitions and disposals of -0.2% and Organic revenue growth of +3.0%. North America delivered organic growth of +1.2%, slightly above the prior quarter, reflecting pricing (+3%) offset by contracts exits. Europe grew +3.3% organically, an improvement versus prior quarter, driven by solid momentum in Healthcare & Seniors, partially tempered by softer trends in Corporate Services and Education. Rest of the World grew +7.5% organically, driven by continued performance in India, Brazil, and Australia which stands out thanks to robust commercial traction. Outlook: Organic revenue growth between +3% and +4% | ||
|
|
|
|
|
|
SAAB B |
Saab AB | ||
|
SEK |
498.35 |
-5.54% | |
|
SAAB B |
Saab has received an order from the Swedish Defense Materiel Administration (FMV) for the mobile short-range air defense solution RBS 70 NG with missiles. The order value is approximately SEK 1.5 billion and deliveries are scheduled 2027-2028. This order was booked in Q2 2025 | ||

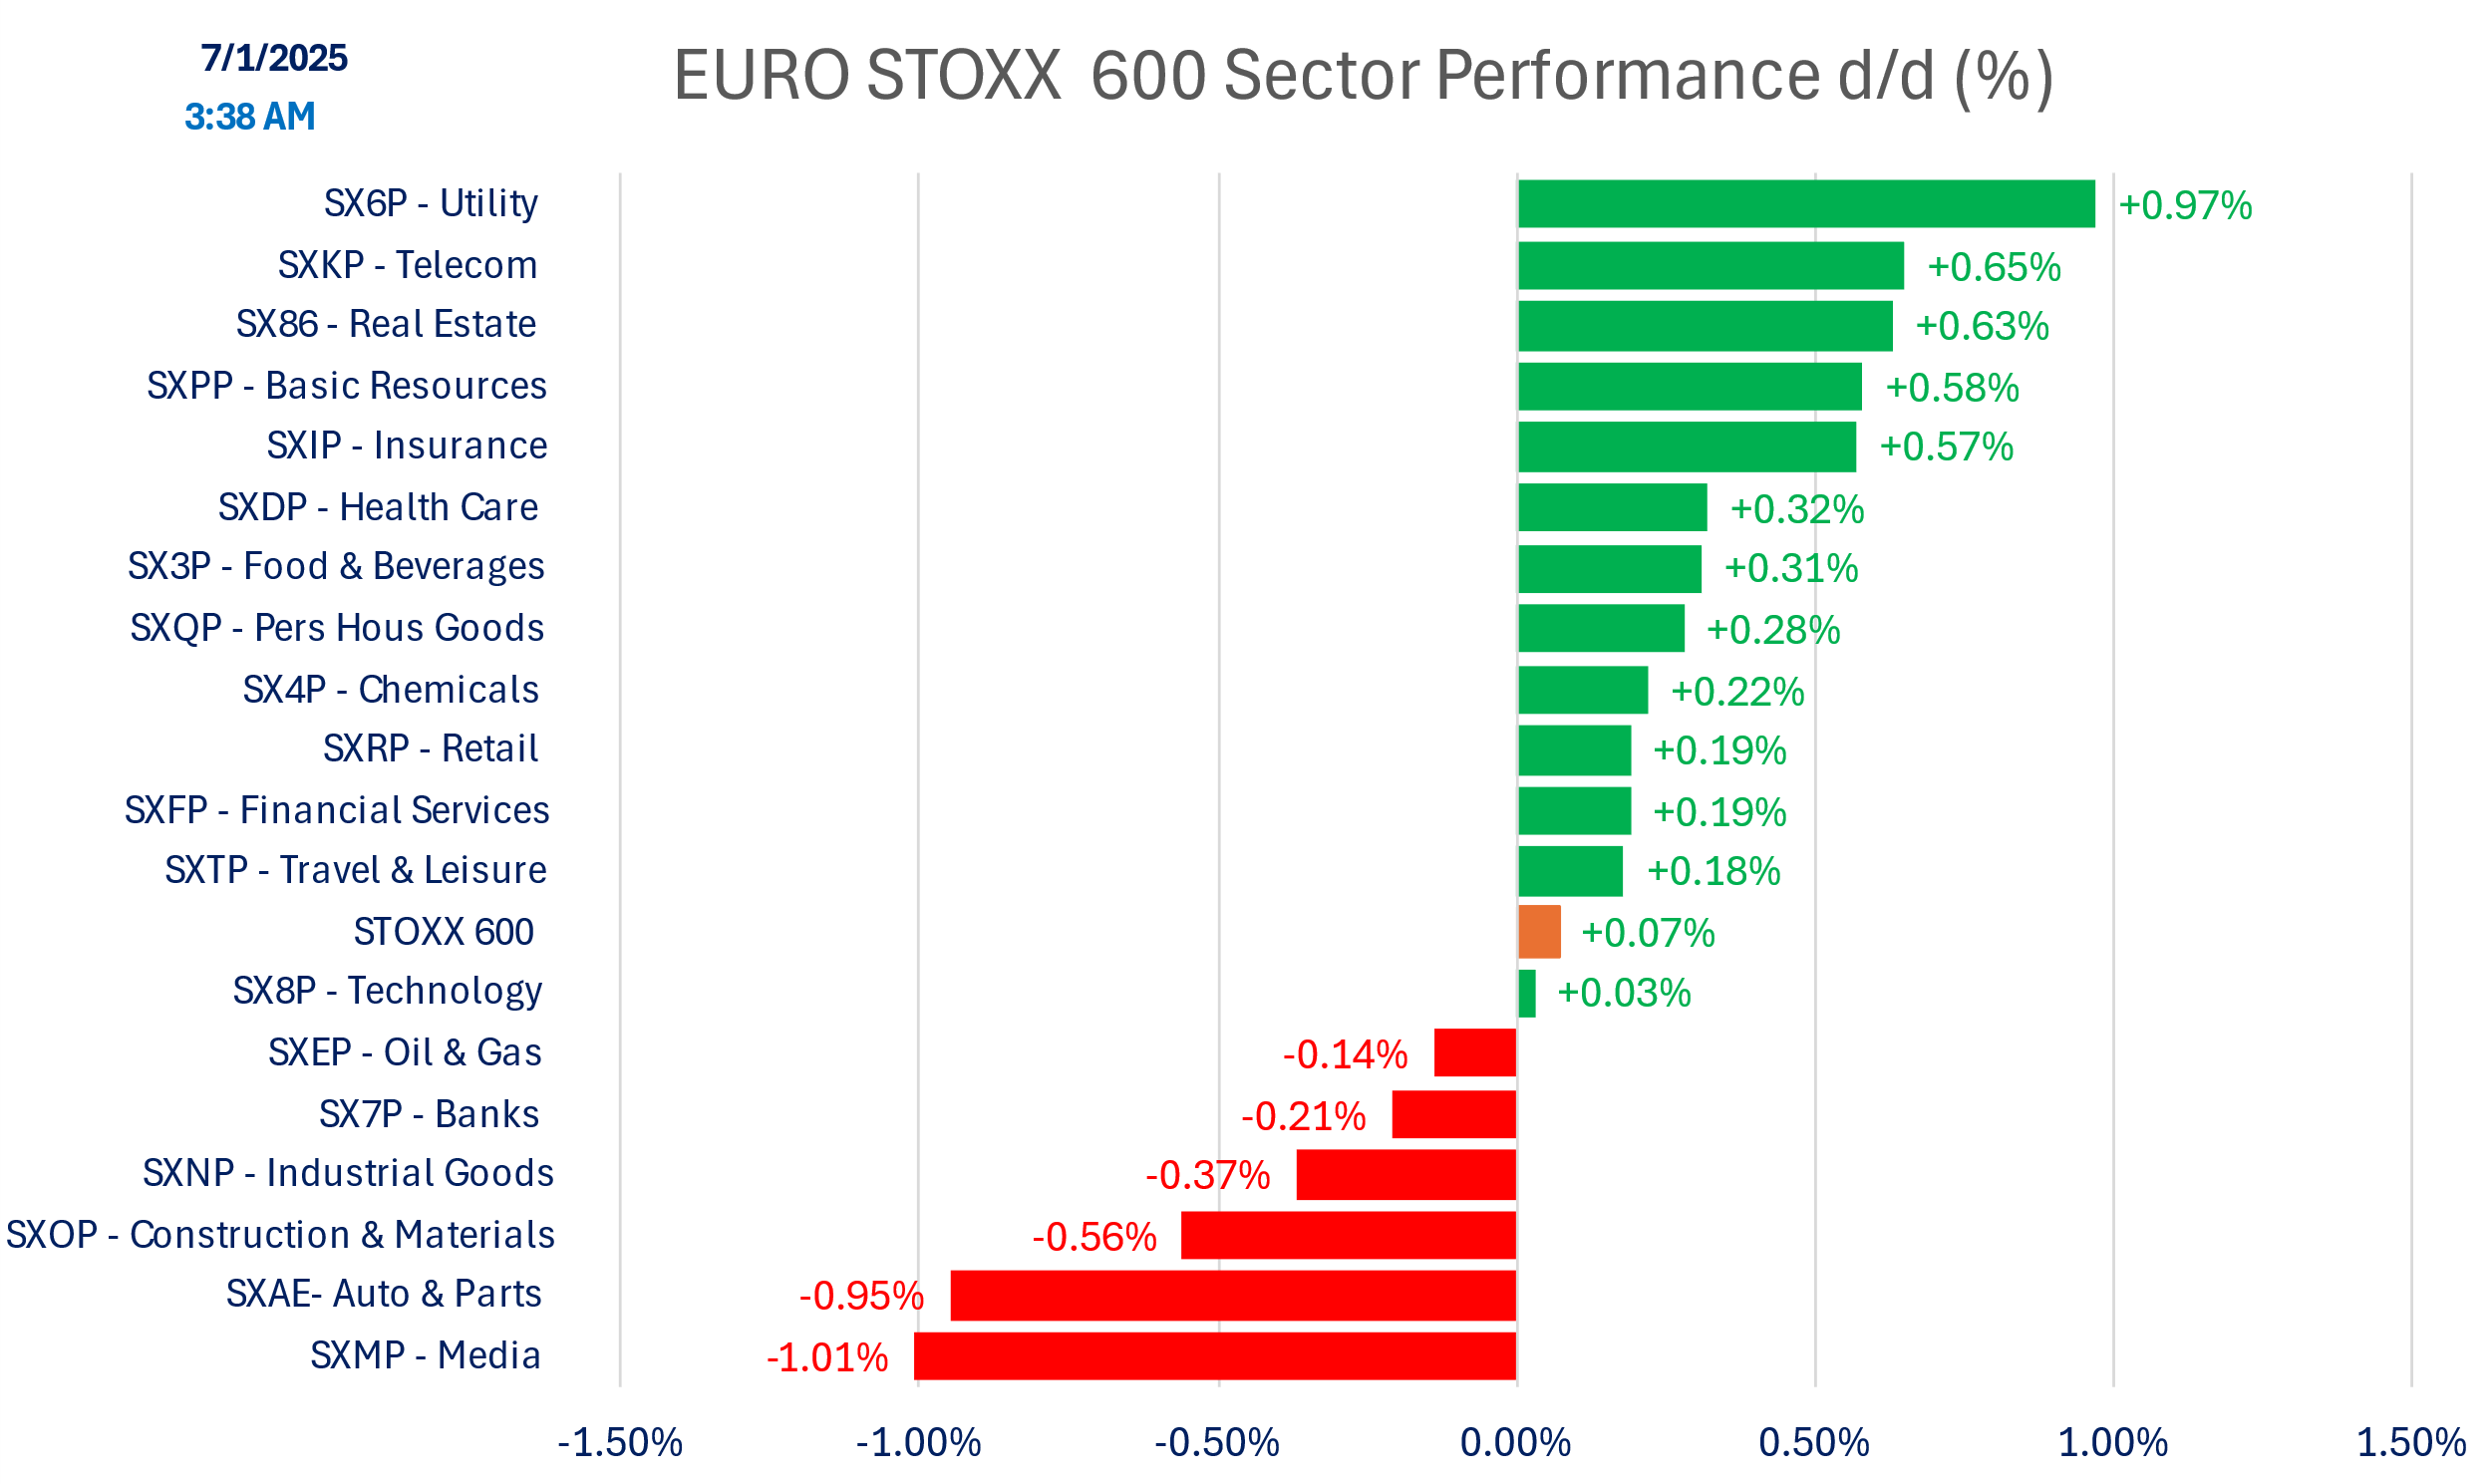
Versus early hours:
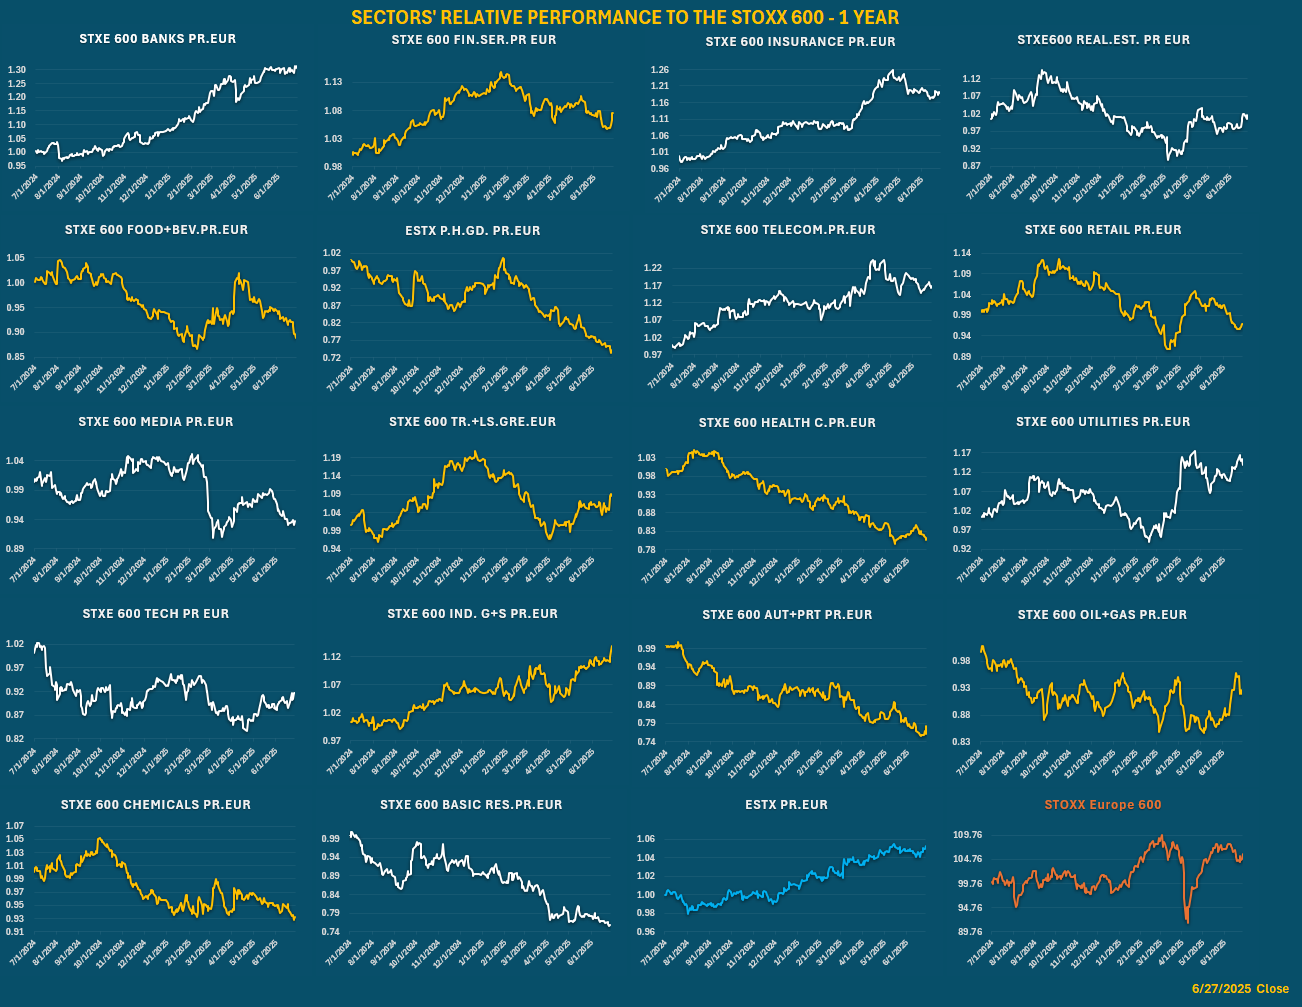
SECTOR PERFORMANCE
Relative performance to STOXX 600
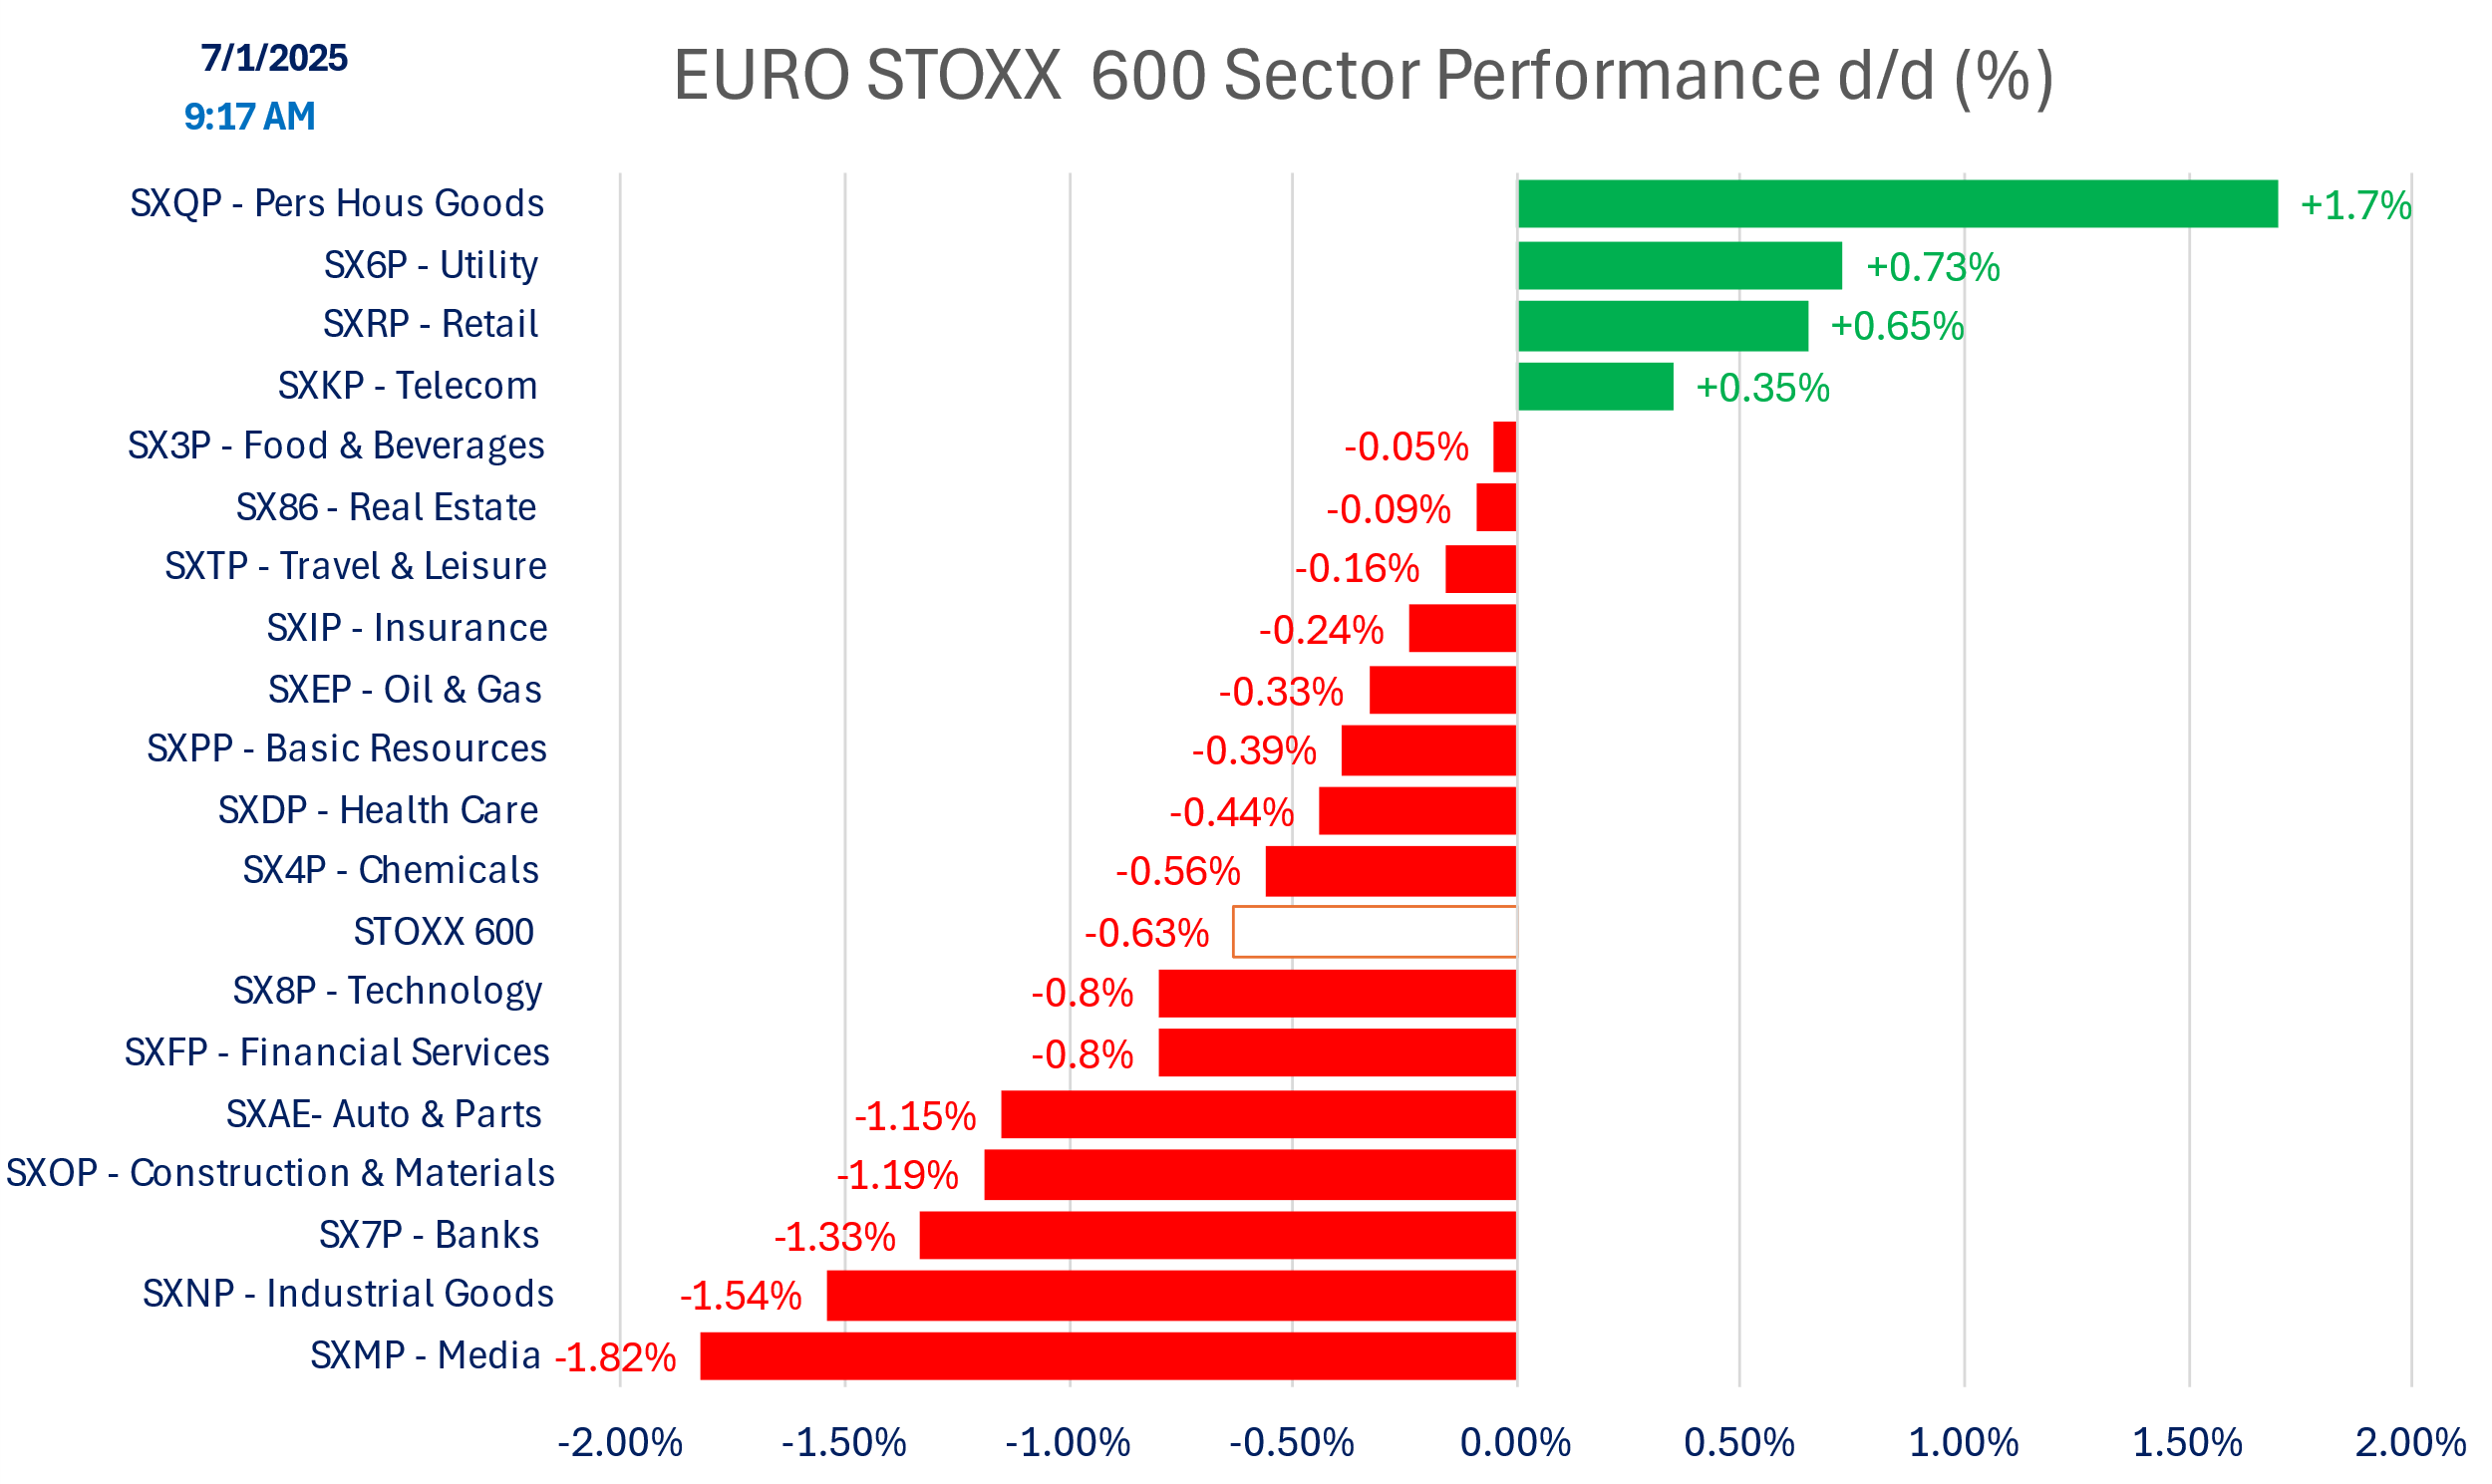
Today’s Performance
Versus early hours:

Indices

Versus early hours

Commodities

DISCLAIMER
This material is provided by Eurolink Securities L.L.C. for information purposes only and is not intended as a recommendation or an offer or solicitation for the purchase or sale of any security or financial instrument. The opinions, forecasts, facts, and recommendations contained here are based upon the information available as of the date of the report. The analysts are basing their opinions upon information they have received from sources they believe to be accurate and reliable. The report is directed exclusively at Institutional Investors who make their own decisions regardless of the present publication or opinions reflected within the report. This material is not a complete analysis of all material facts respecting any issuer, industry, or security or of your investment objectives, parameters, needs or financial situation, and therefore is not a sufficient basis alone on which to base an investment decision. A guarantee of completeness and accuracy of the information in this report is not assumed by Eurolink Securities LLC and any liability arising from the use of this report is excluded and disclaimed. The information contained herein is as of the date and time referenced above. Opinions and recommendations are subject to change without notice. Eurolink Securities L.L.C. has any obligation to update such information. Past performance is not indicative of future results. The investments discussed may fluctuate in price or value. Changes in rates of exchange may have an adverse effect on the value of investments. Transactions involving the financial instruments mentioned herein may not be suitable for all investors. Eurolink Securities L.L.C. has no obligation to continue to provide this research product and no such obligation is implied or guaranteed. The distribution rights of this report belong solely to Eurolink Securities L.L.C. It is prohibited to publish or to give this report or parts to third parties. No parts of it may be reproduced, resold, stored, or transmitted in any printed, electronic, or other form, or used for generating or marketing any printed or electronic publication, service, or product without Eurolink Securities LLC’s previous approval.