Happy 4th of July.
US market closed on the day the US president will sign the Reconciliation “Beautiful Bill”, maintaining the package approved by the Senate, i.e. with a $5tn increase of the debt ceiling and steeper deficits in the early years.
The latest Fed Balance sheet shows an increase in the TGA week-over-week as of July 2, when a decline was expected. The US treasury will start rebuilding the TGA with new net issuance in coming weeks but starting from a higher point for the TGA than expected. US Treasury Secretary Scott Bessent said yesterday that the rebuilding of the TGA will be done through T-Bill, not expecting to increase issuance of notes and bonds, expressing the belief that yields will come down with lower inflation as the Fed will end up easing. The increase in T-bill issuance (we are still talking ~ +$500bn needed to bring the TGA to the $850bn target) will still draw down reserves and liquidity with no help from the RR this time around (unlike in 2023). The SLR change (September) will help absorb some of the issuance and Bessent expects the growth in stable coins to support T-Bills demand, but we still see lower liquidity and reserves. Moreover, the approach exposed the US Treasury to higher inflation surprises and will undoubtedly incite the administration to increase pressure on the Fed to cut rates.
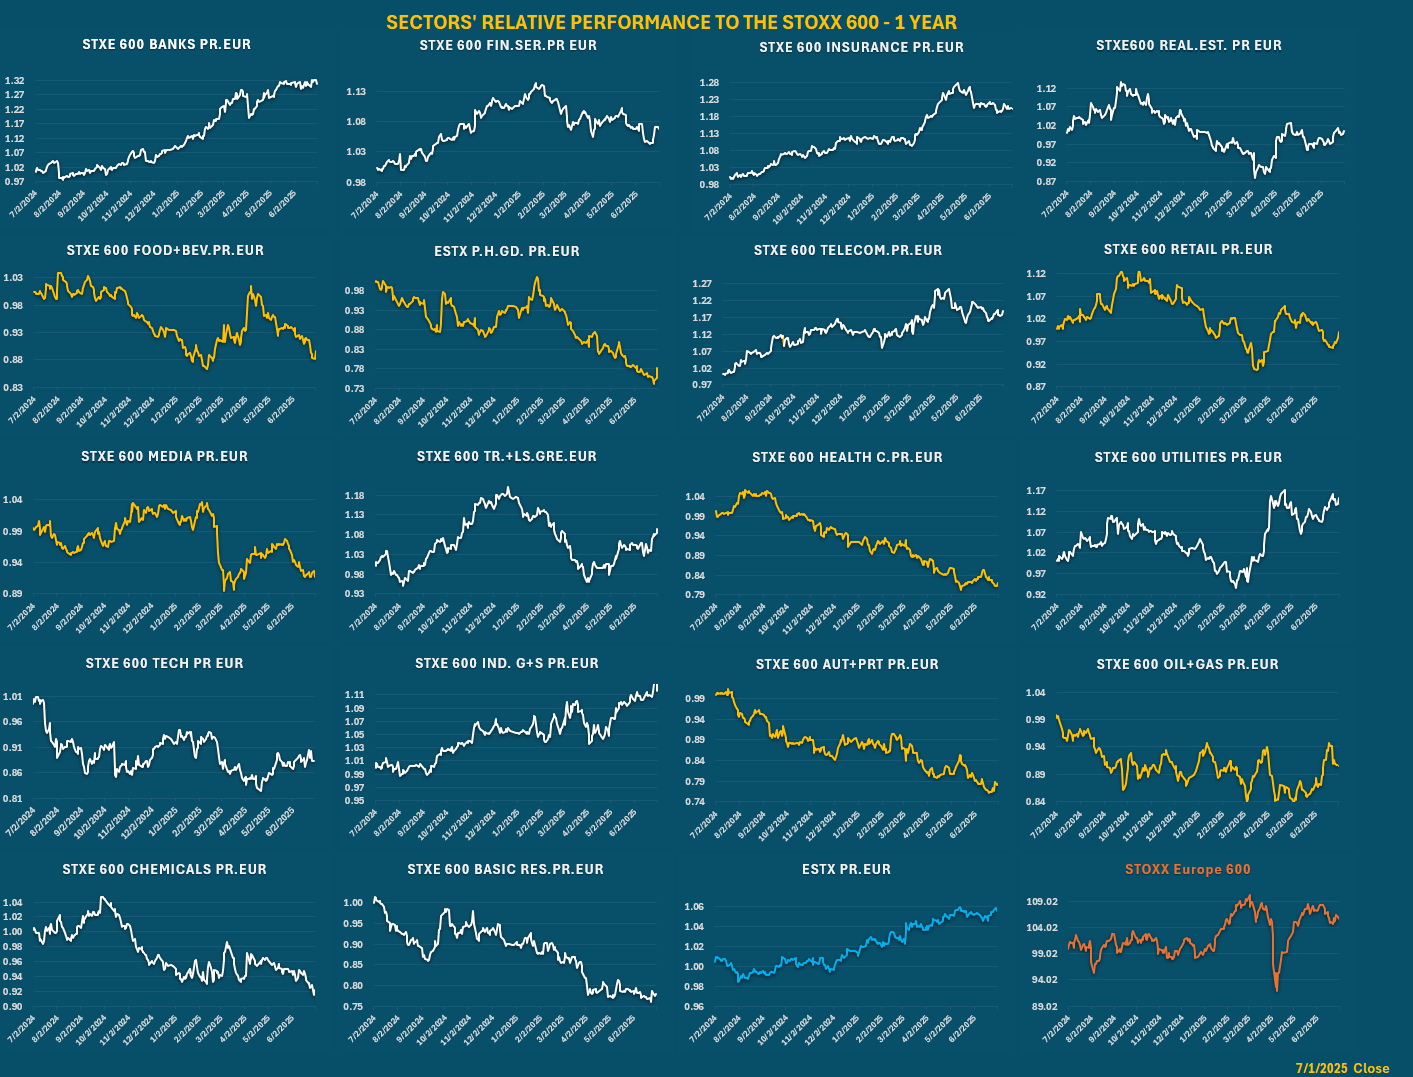
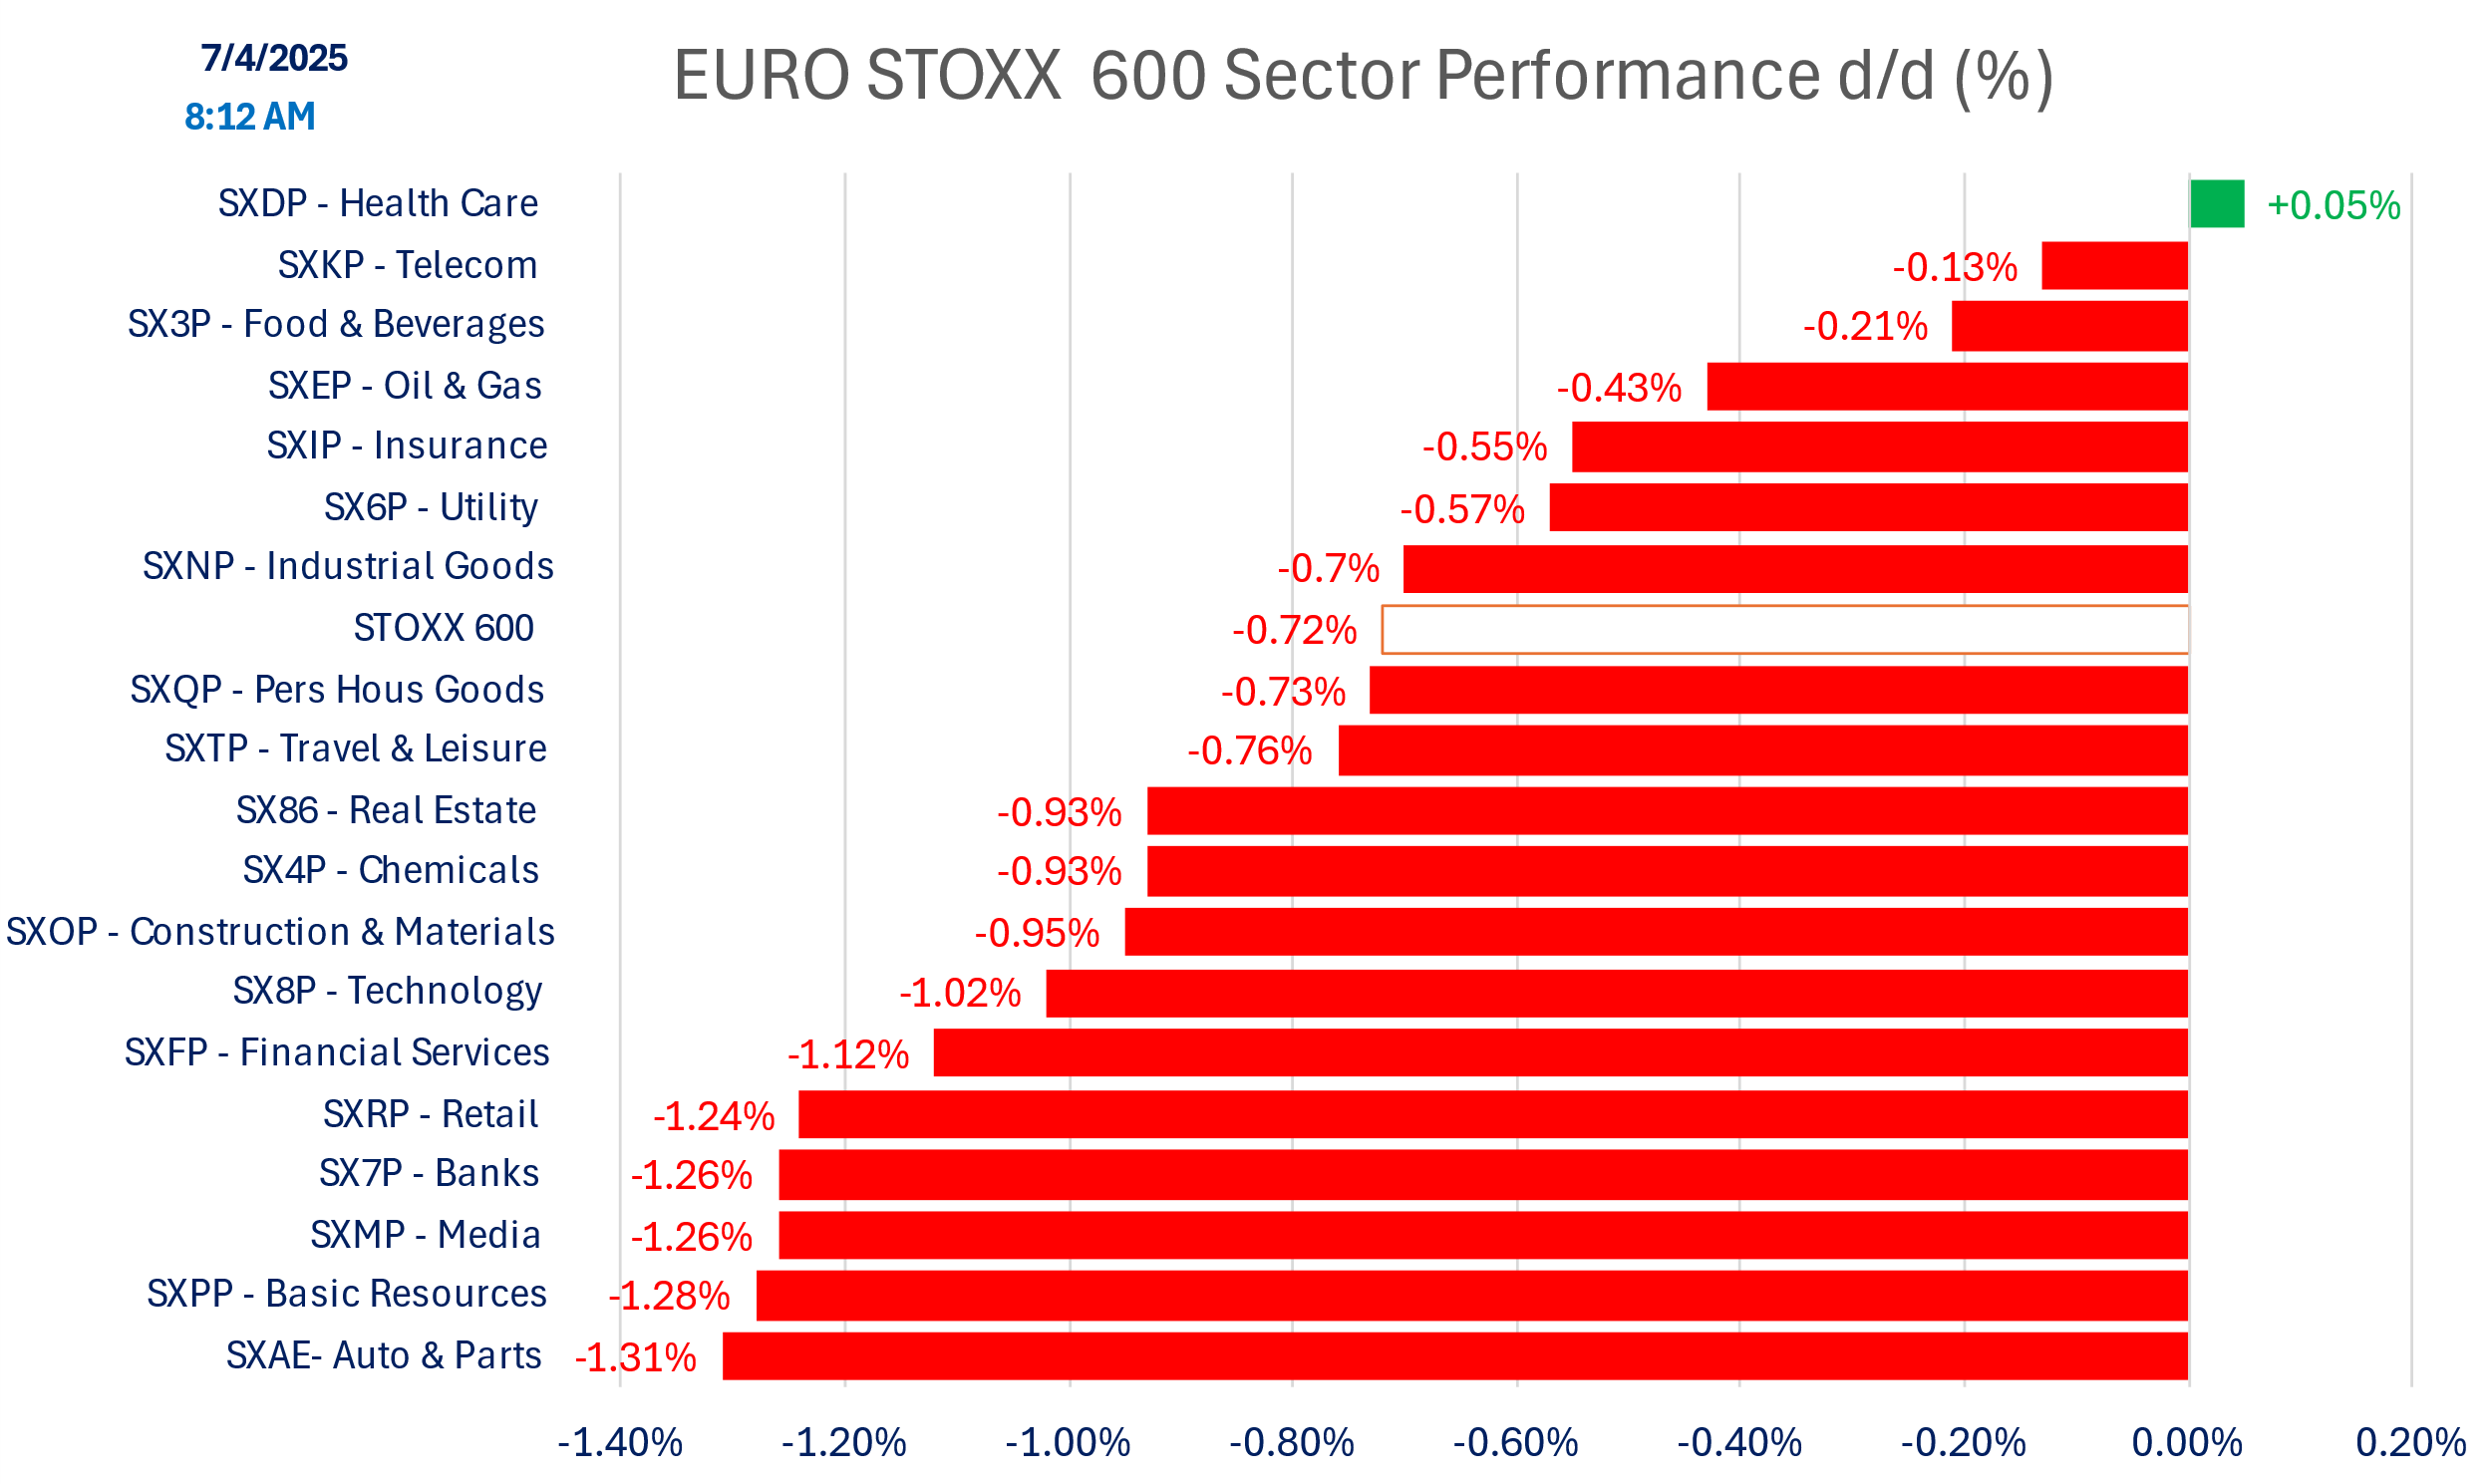
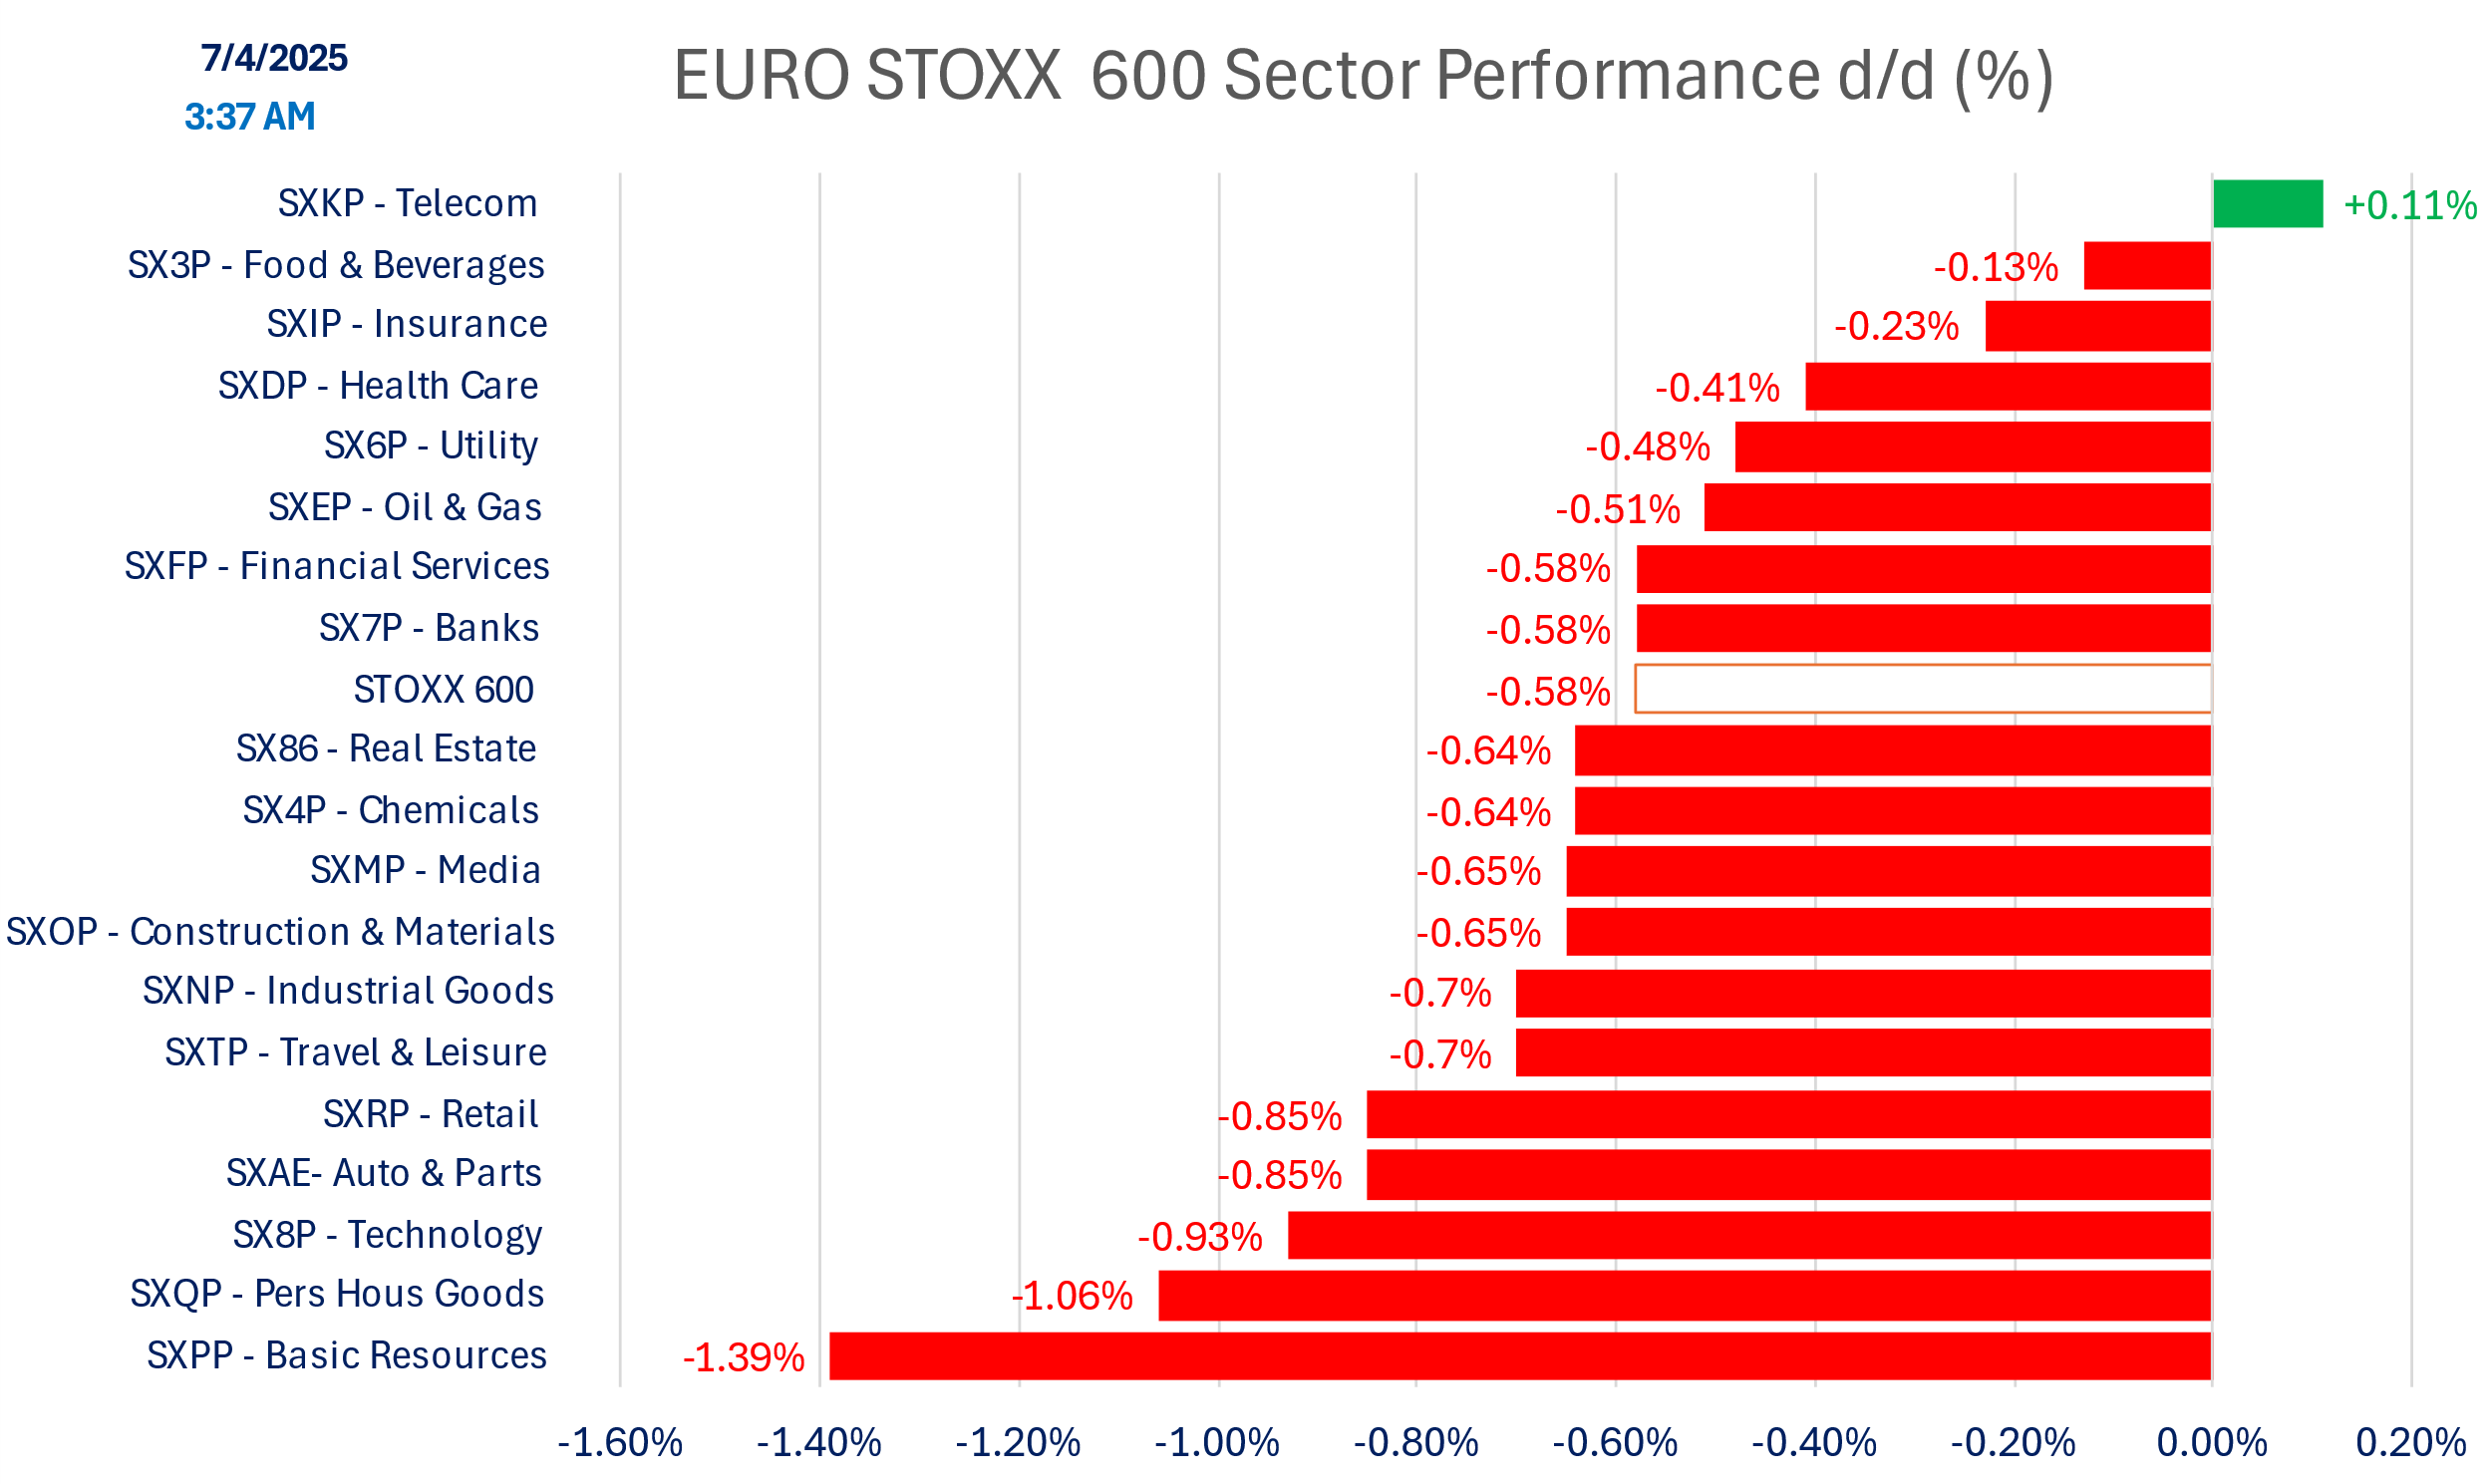
With the OBBB out of the way, focus is back on tariffs. The $ is little changed, Yields are lower, and European stocks are declining and worsening from the open. All sectors (but Telecom) are down. Basic resources and auto are down the most amid some growth and tariffs concerns.
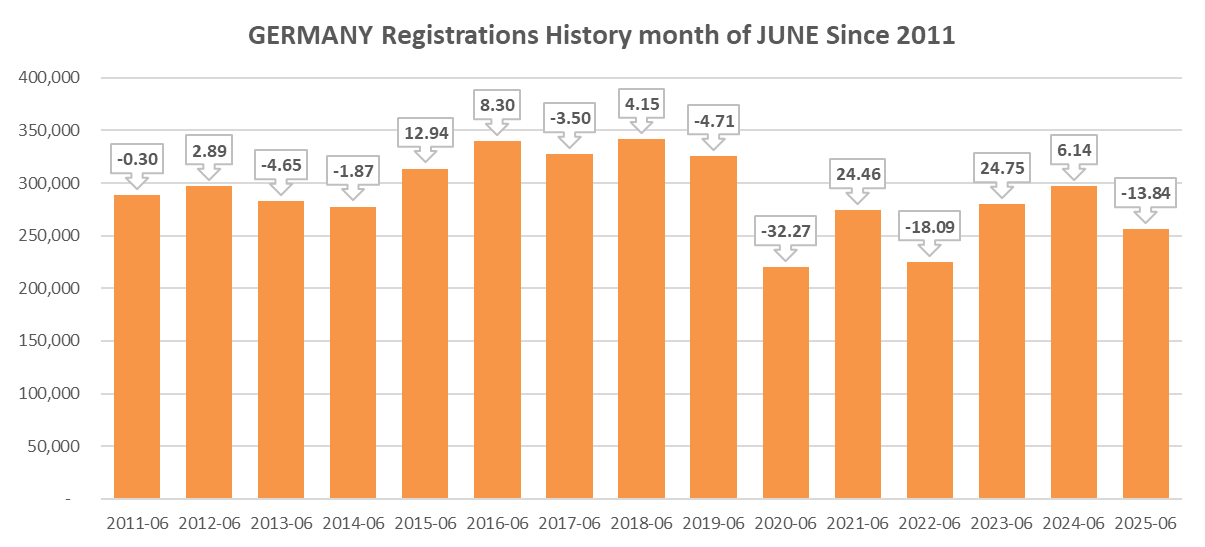
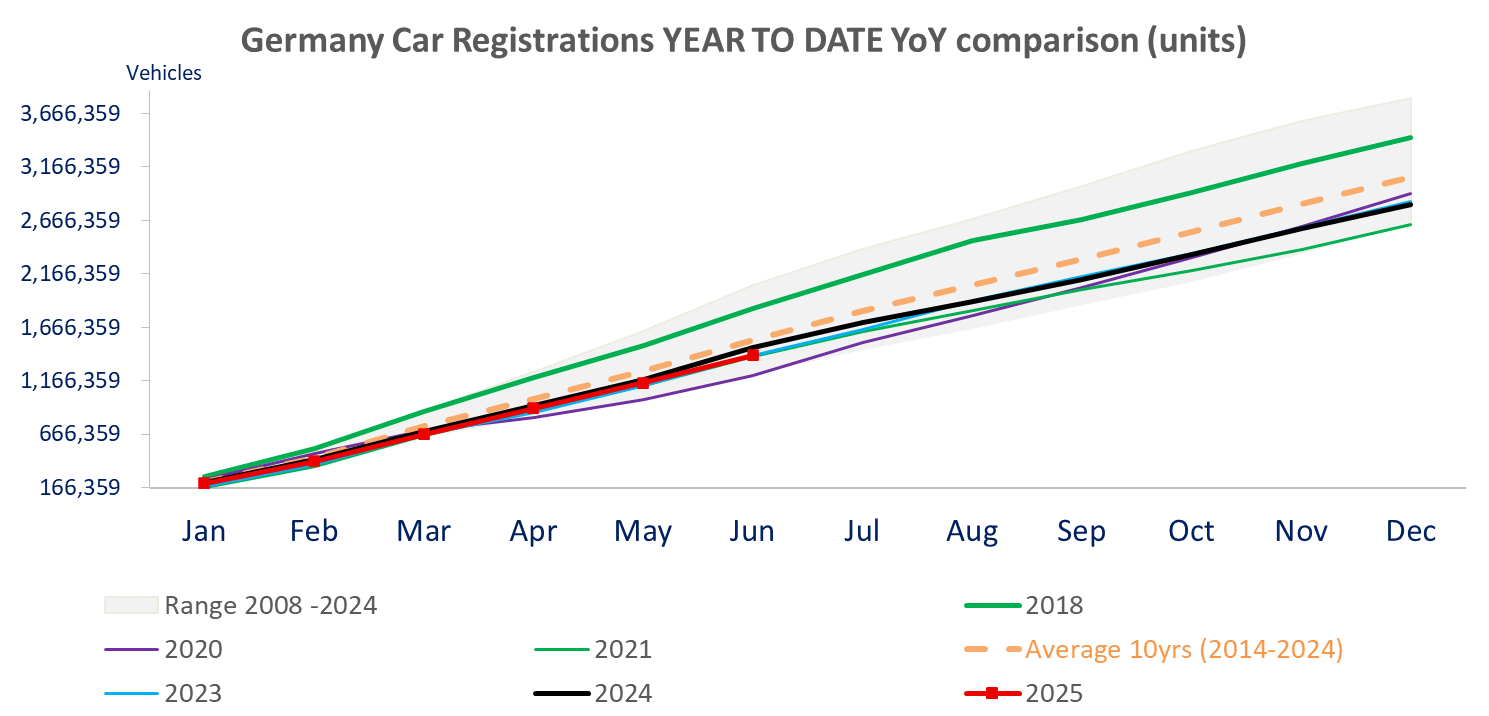
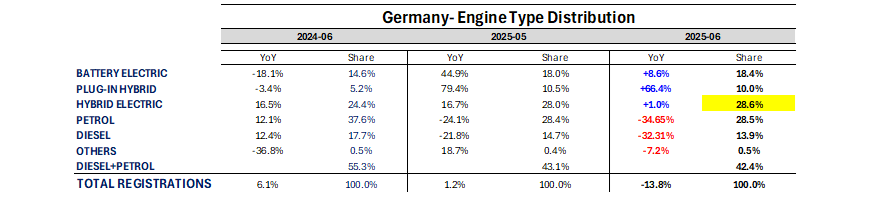
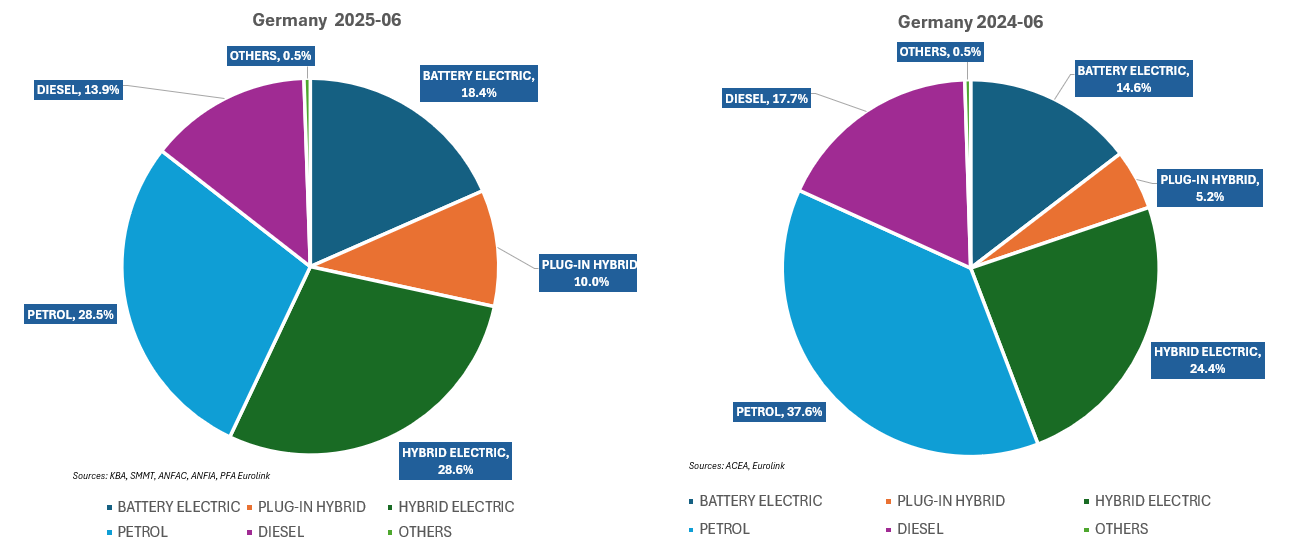
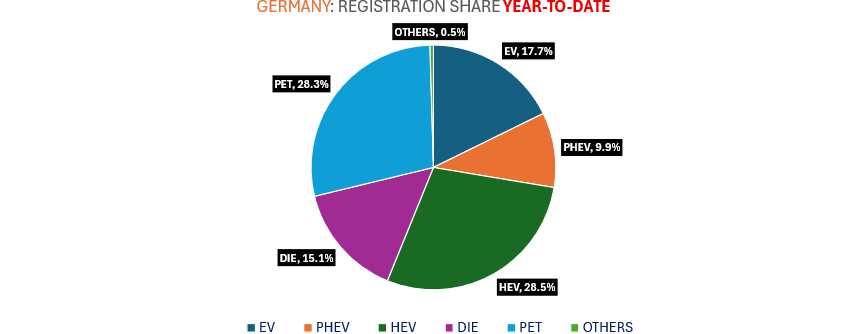
The German car registrations for June are on the weak side with 256,193 vehicles, down -13.8% yoy in June and down -4.7% yoy ytd. Registrations for the TOP-4 Eurozone countries are only down -8.8% yoy in June and down -2.6% yoy ytd. as Spain is still up +13.9%yoy.
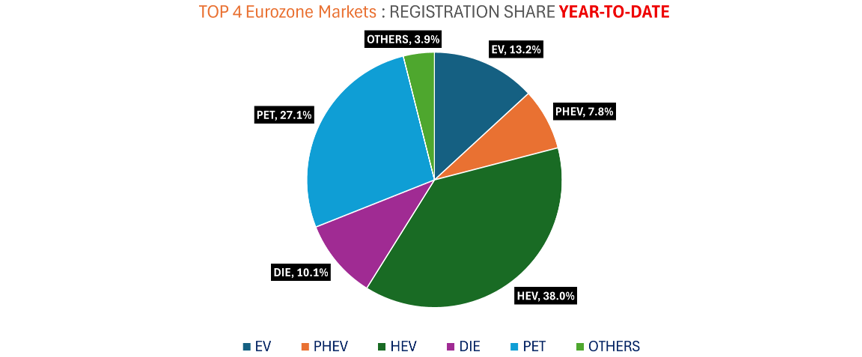
For the TOP 4, on a year-to-date basis PHEV saw the strongest growth in the Top-4, up 29.7% yoy to 288,817 cars (share of 7.8% up 1.9points yoy), followed by EV, up 21.3% yoy to 488,302 vehicles (share of 13.2% up 2.6 points). The largest market remains HEV, with 1,407,905 cars sold year-to-date, up 19.4% yoy with a share if 38% up 7 points yoy, a bigger share than Diesel and Petrol engines combined (37.2%).
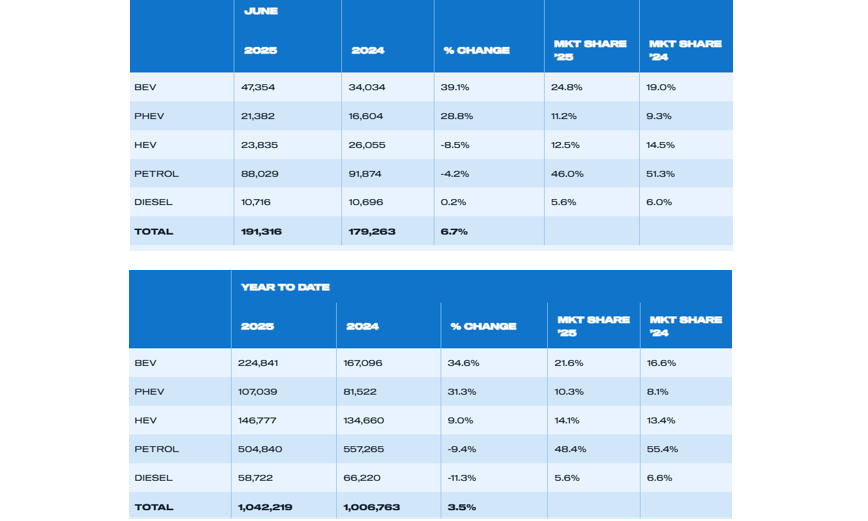
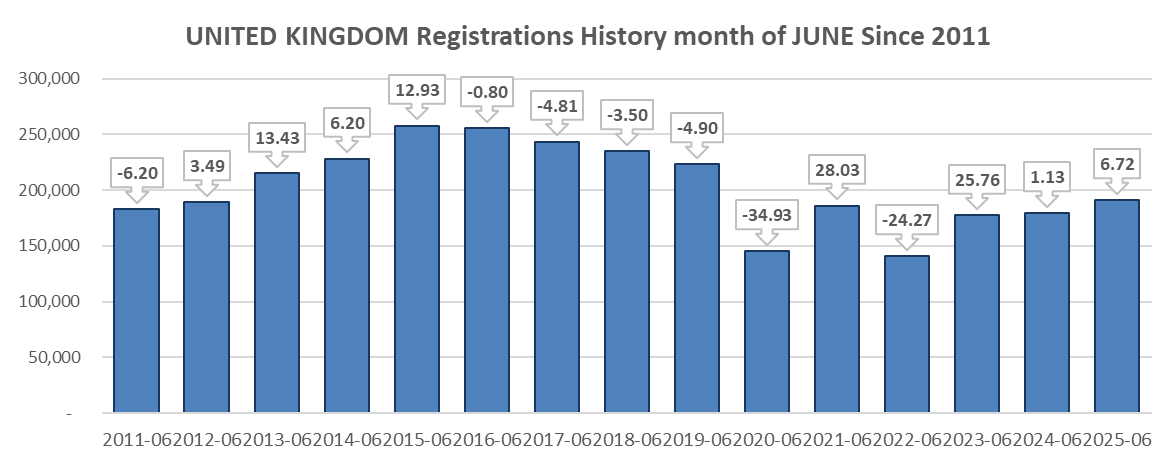
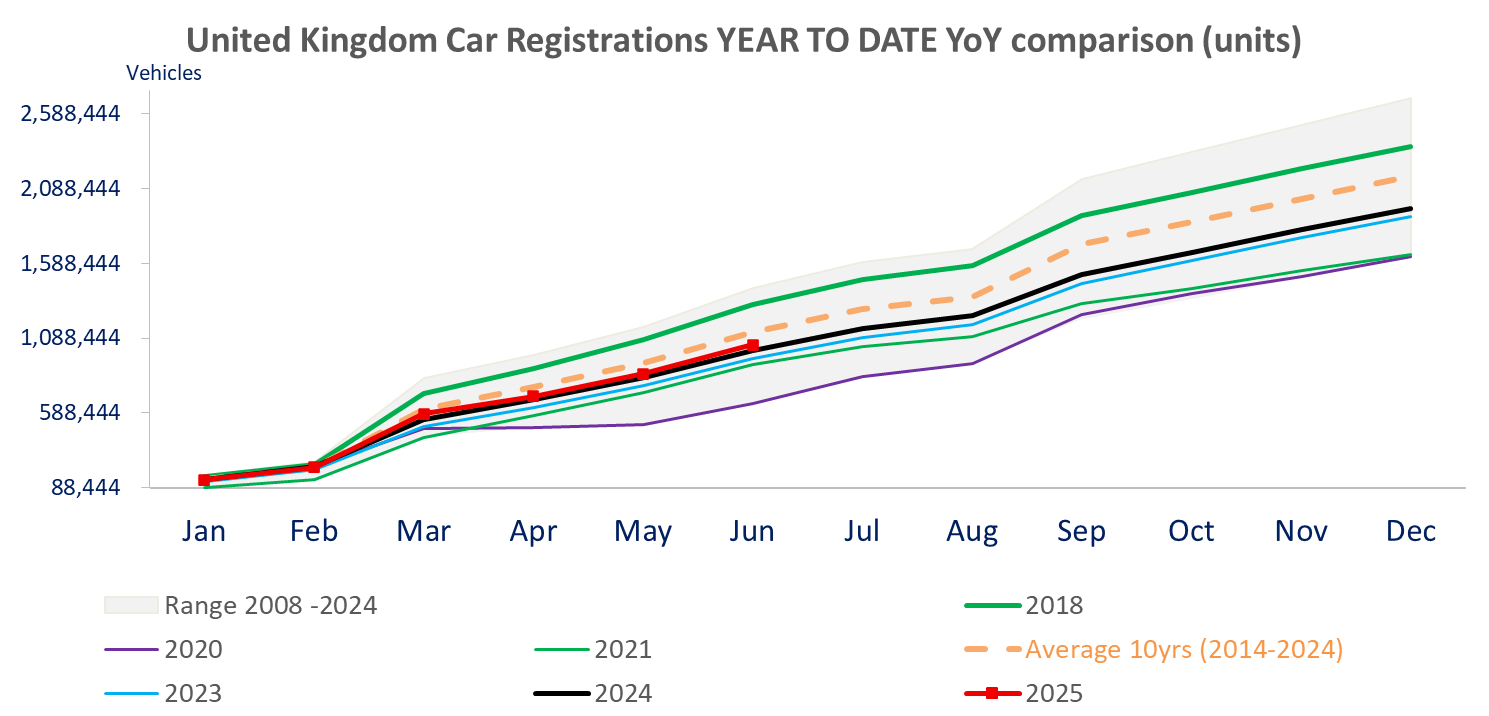
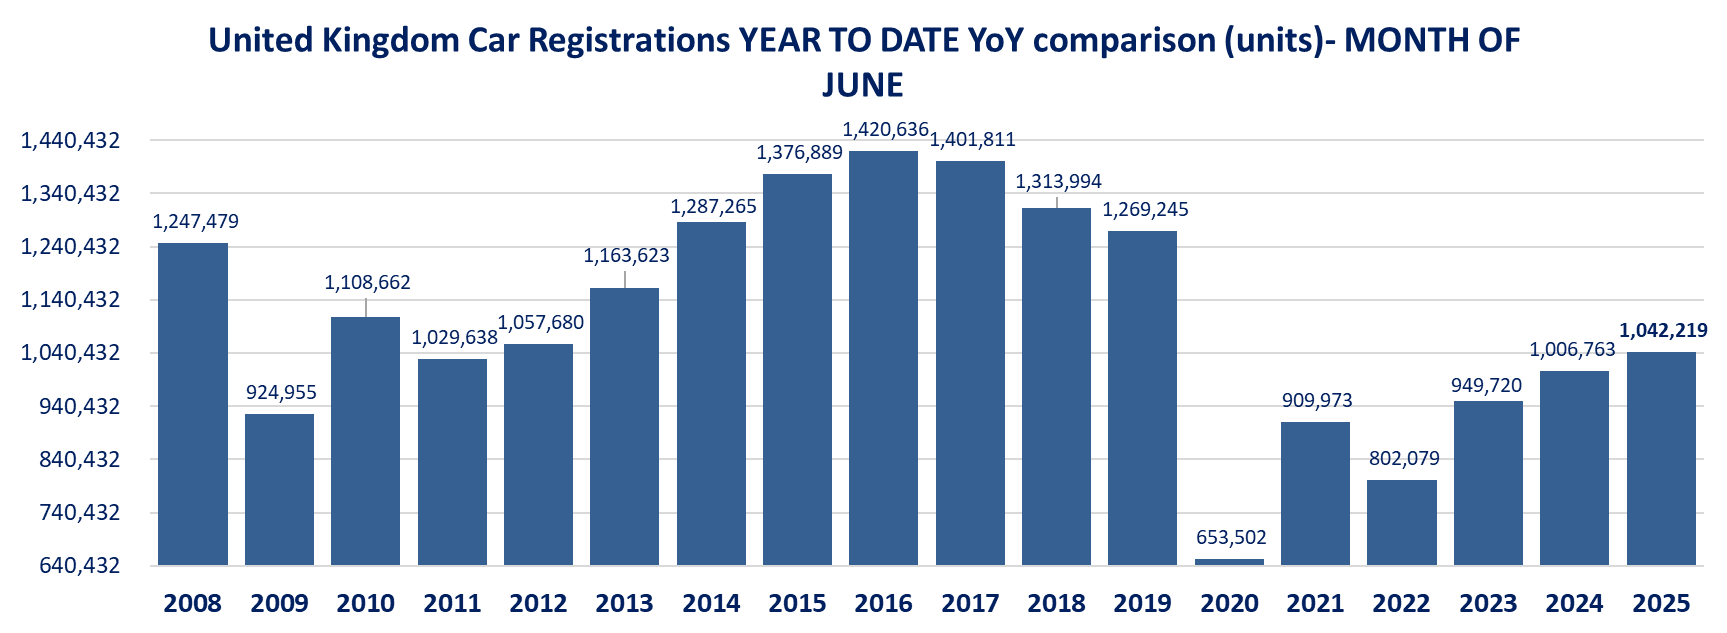
On the other hand, UK registrations are better, up 6.7% yoy to 191,316 vehicles, the best June since 2021. The 6-months registrations reached 1,042,219 cars, up 3.5% and the best first half of since 2019. EV sales are up 39.1% yoy in Jin and up 34.6% yoy ytd
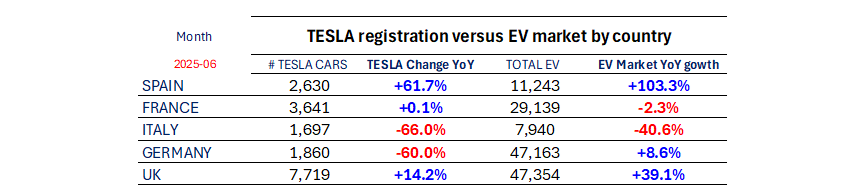
Tesla sales are down -60% yoy in June in Germany when the EV market increased 8.6% yoy. In the UK Tesla sales increased 14.2% but underperforming the EV market (+39.1%), overall underperforming in European markets.
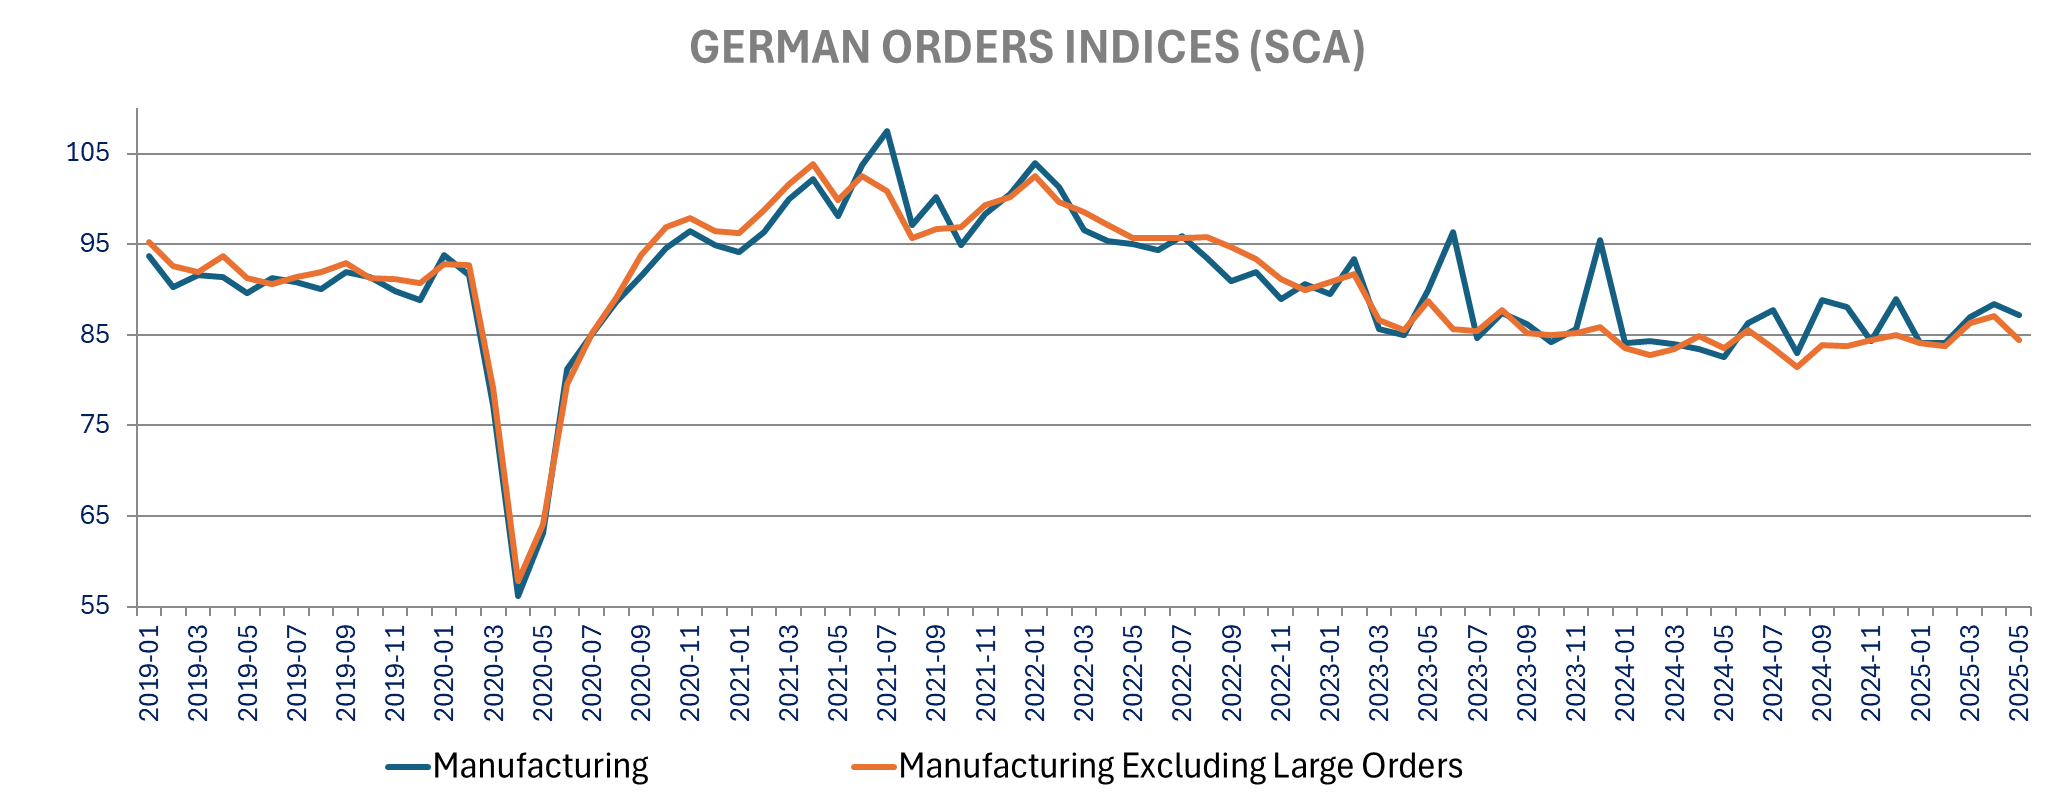
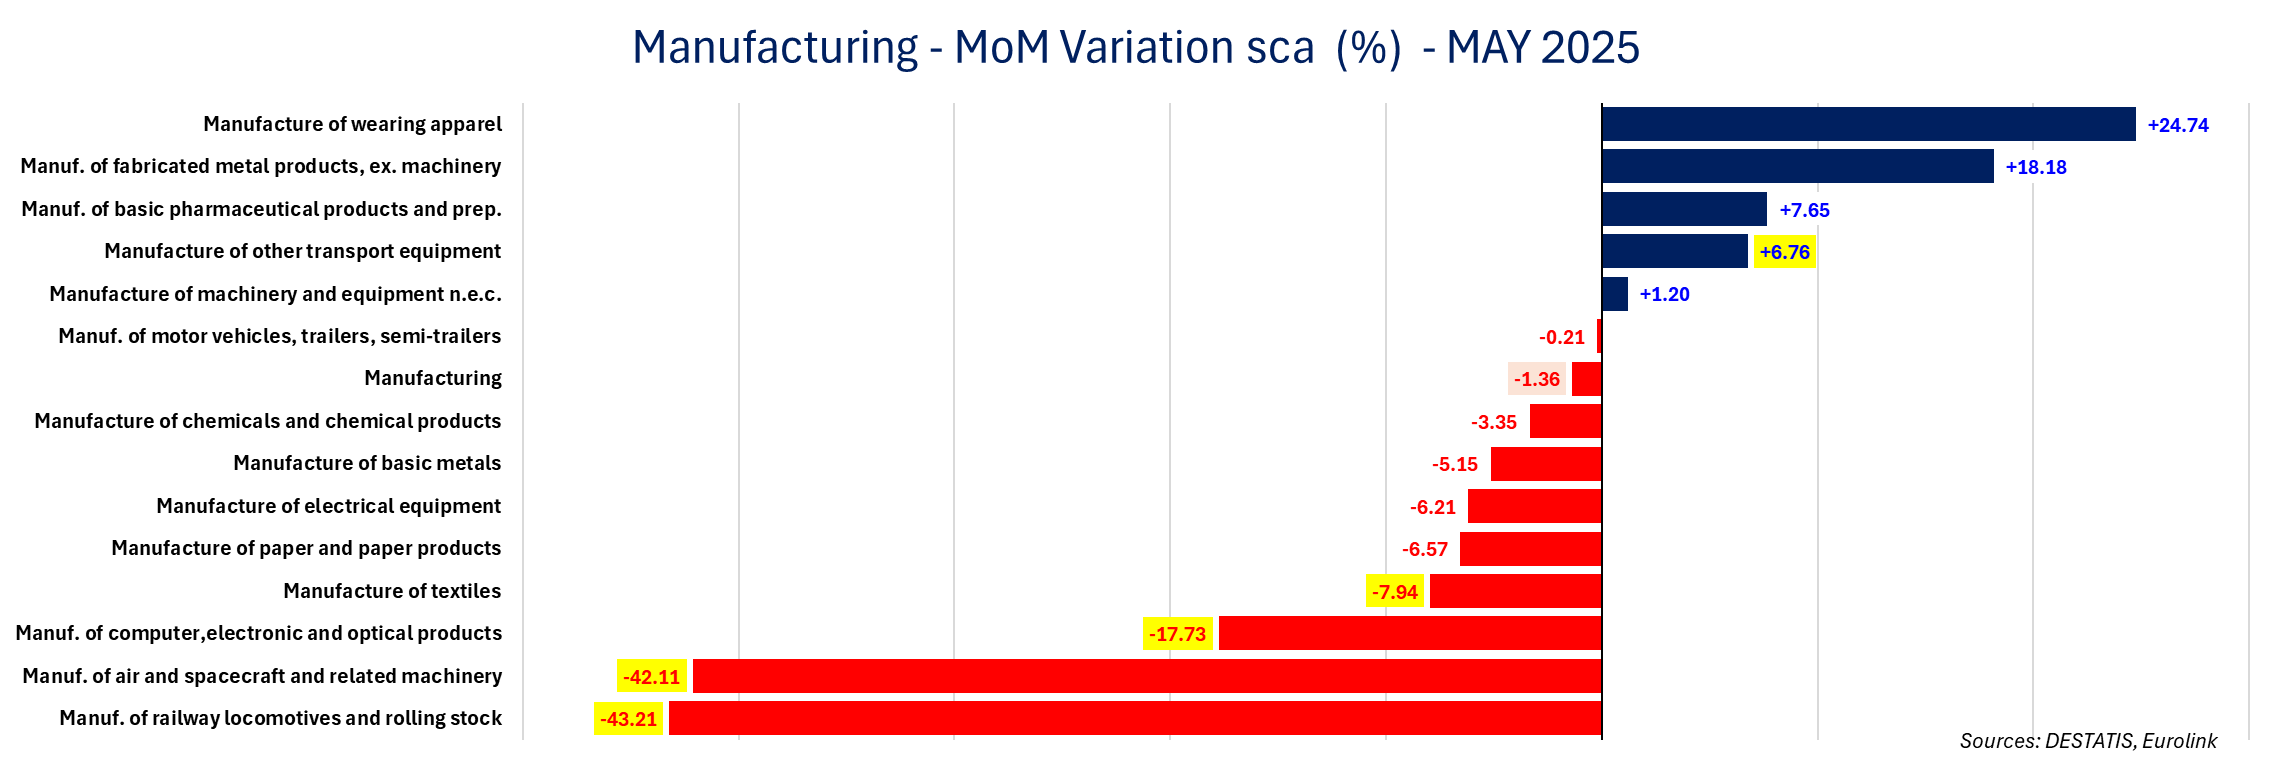
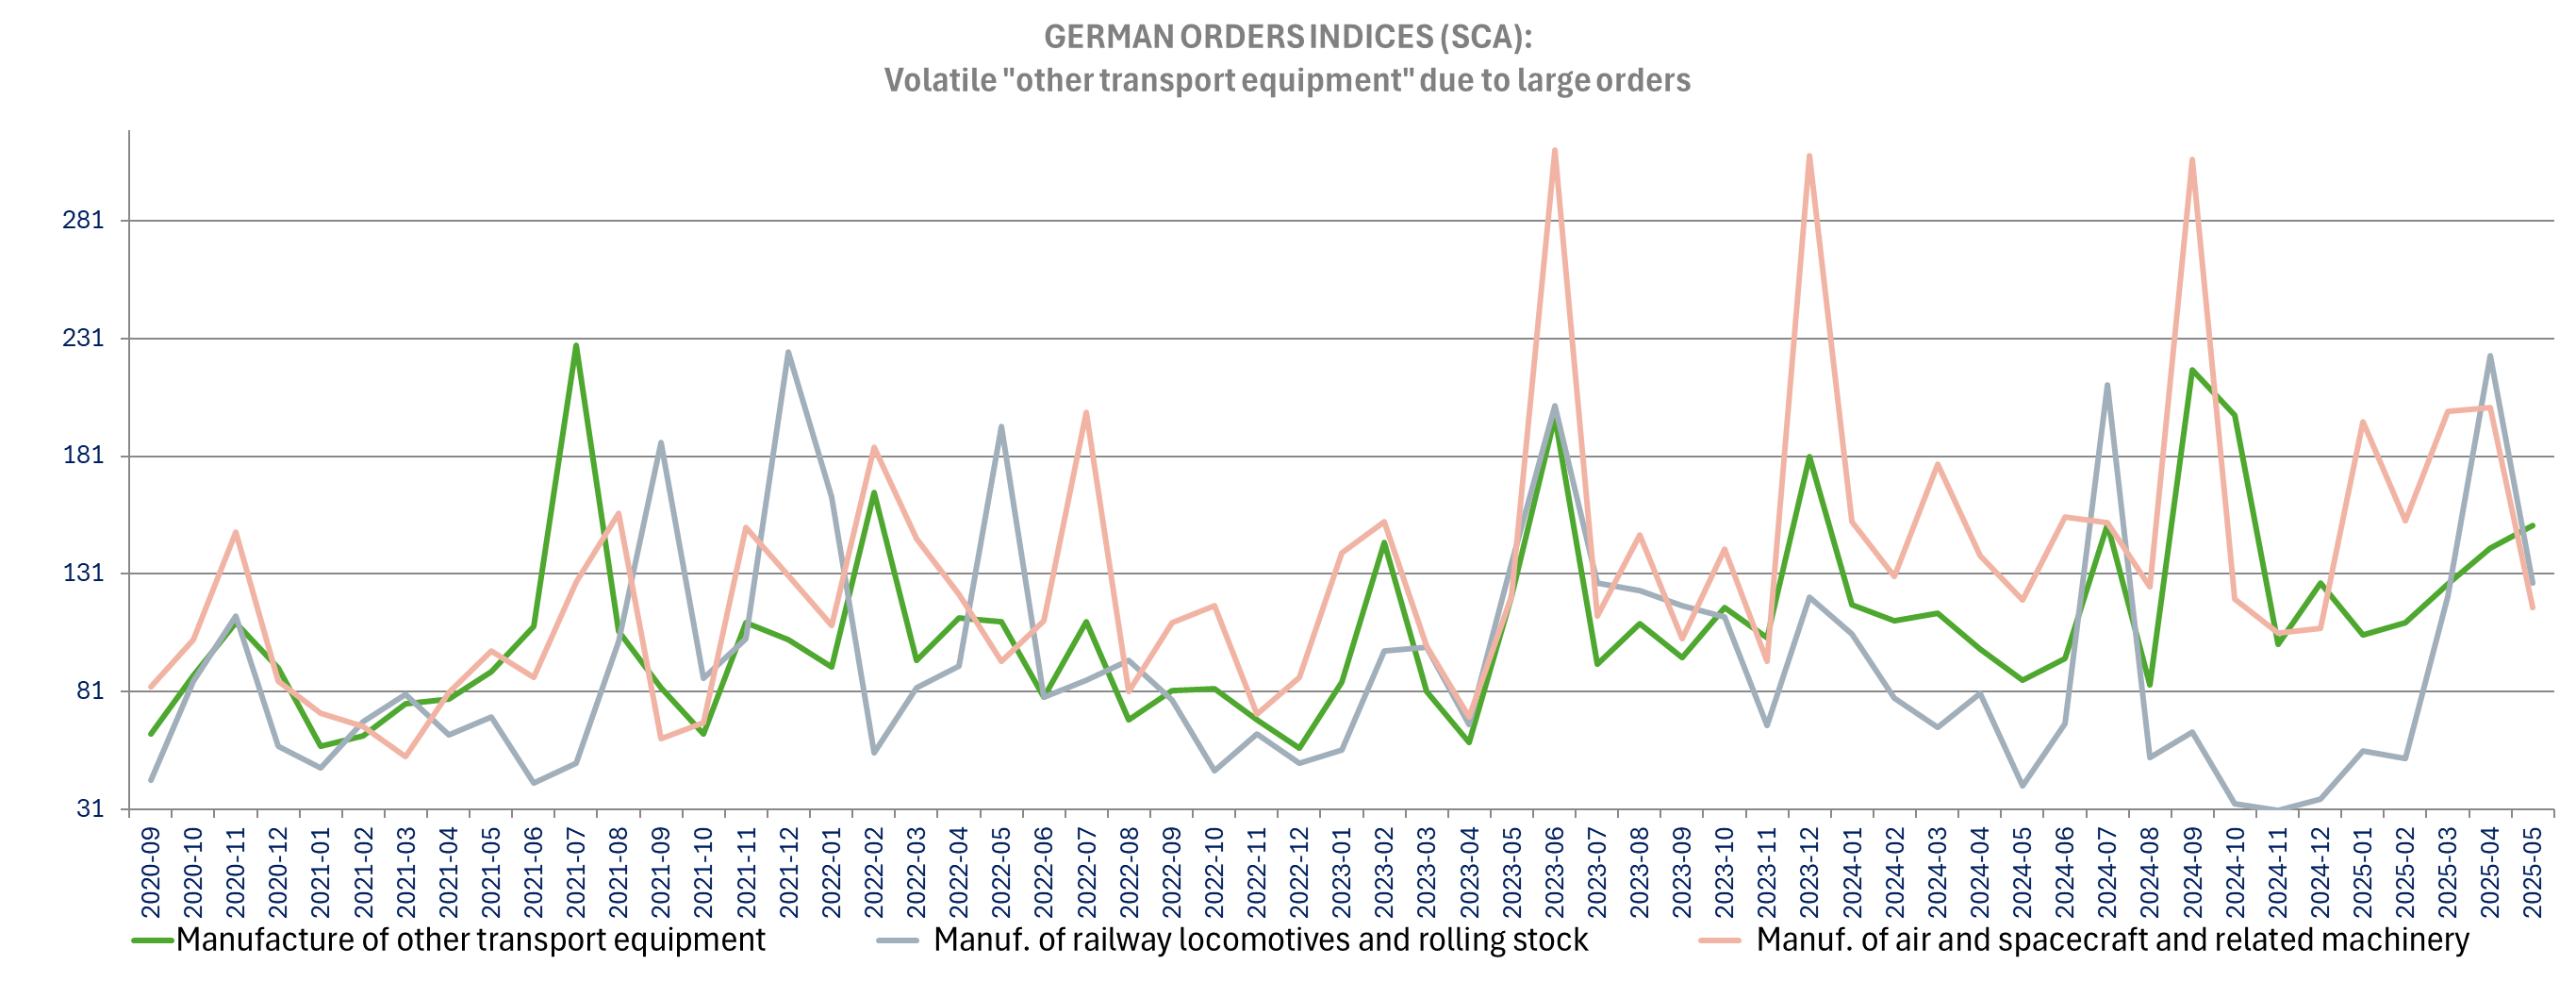
The German May factory orders are down more than economists’ expectations, falling -1.4% m/m vs -0.1%m/m expected but April was revised up markedly to +1.6% m/m from 0.6% m/m, making the miss less significant. That said when excluding larger orders, orders are down -3.1% m/m (with April revised to +0.9%m/m from +0.3%). The -1.4% decline in orders month-over-month is driven by -7.8% decline in domestic orders and -6.5% m/m decline in Eurozone orders, compensated by an increase of 9% from the non-Eurozone. We note a sharp decline in Computer/electronics (-17.7% m/m in May) but after a sharp 21% increase in April on large orders. We also note that other” transport orders are up 6.8% yoy while both aircraft/space and railways equipment are down sharply m/m (-42.1% and -43.2% respectively) suggesting larger orders on the military sides.
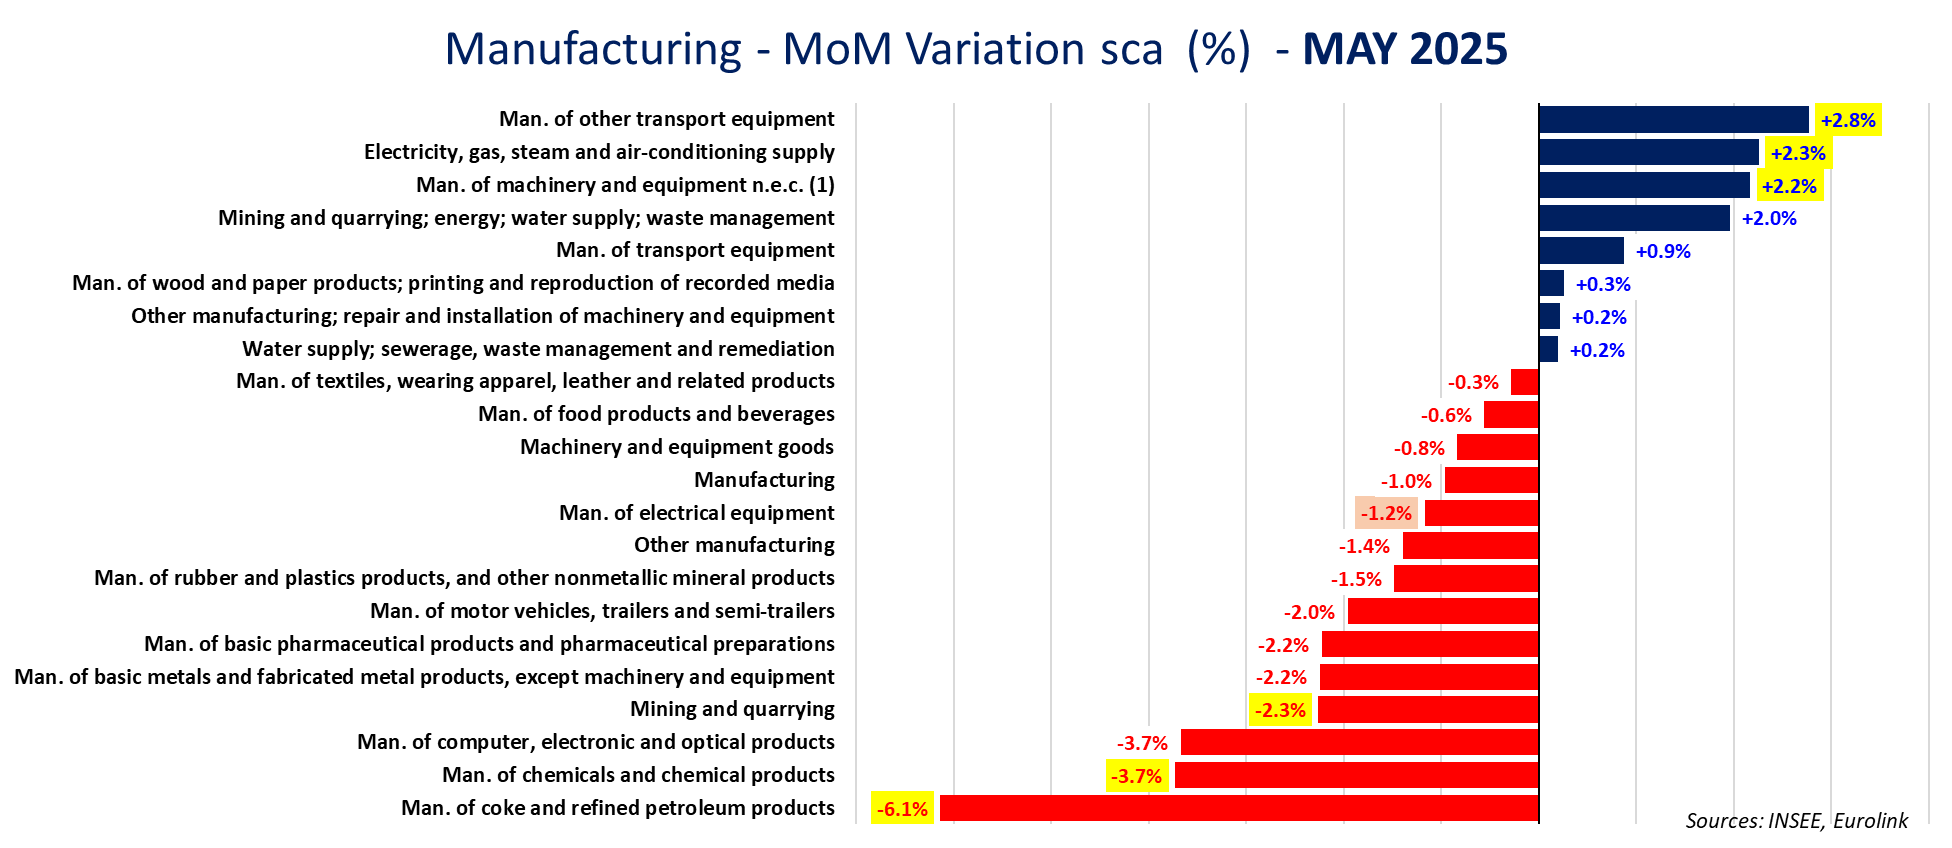
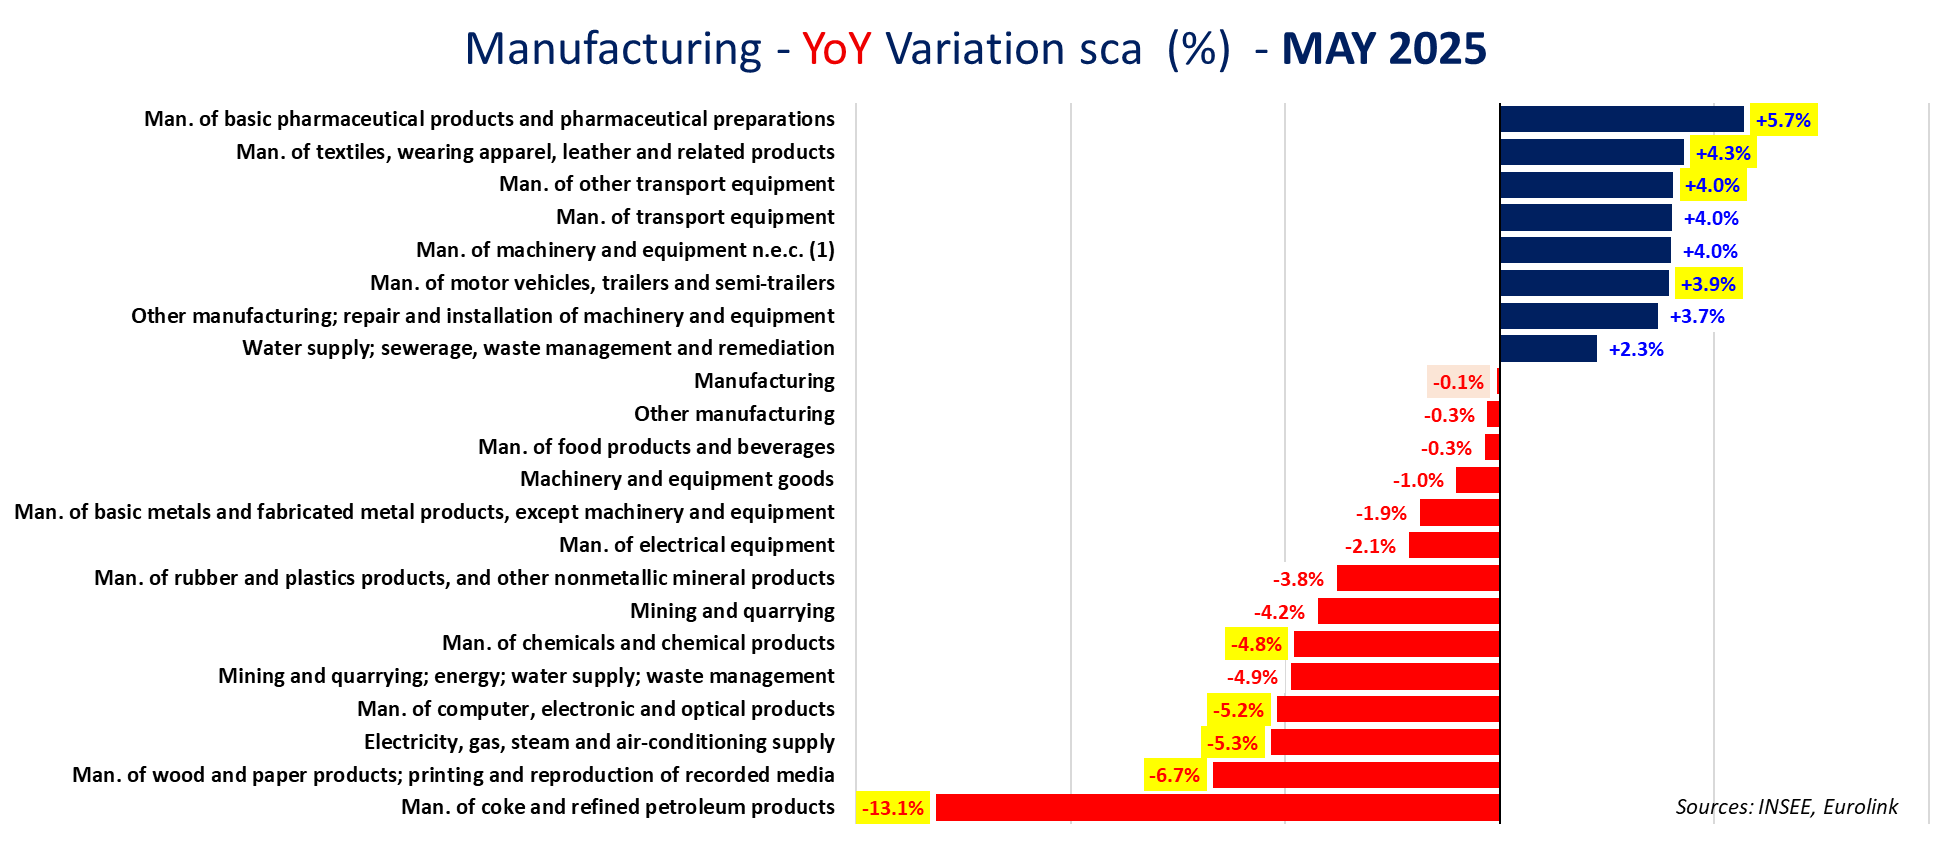
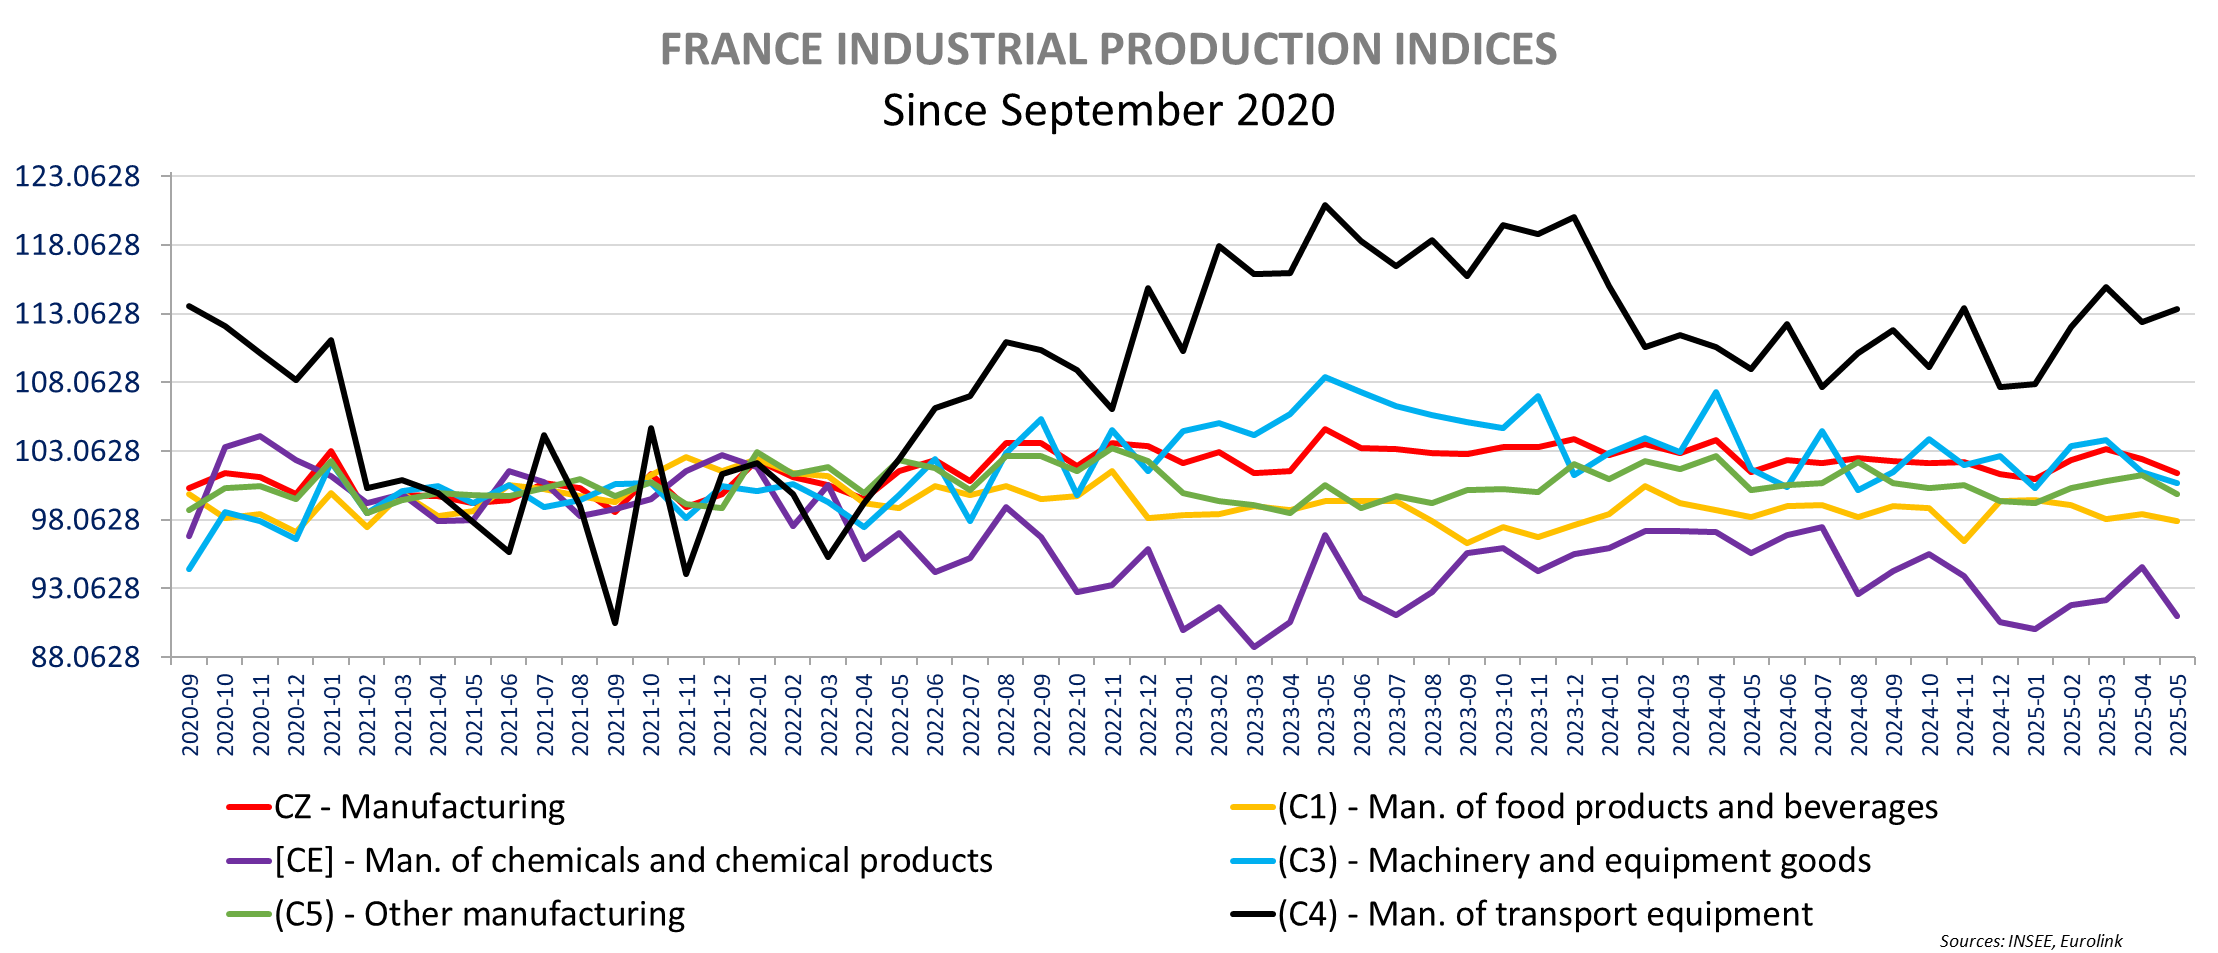
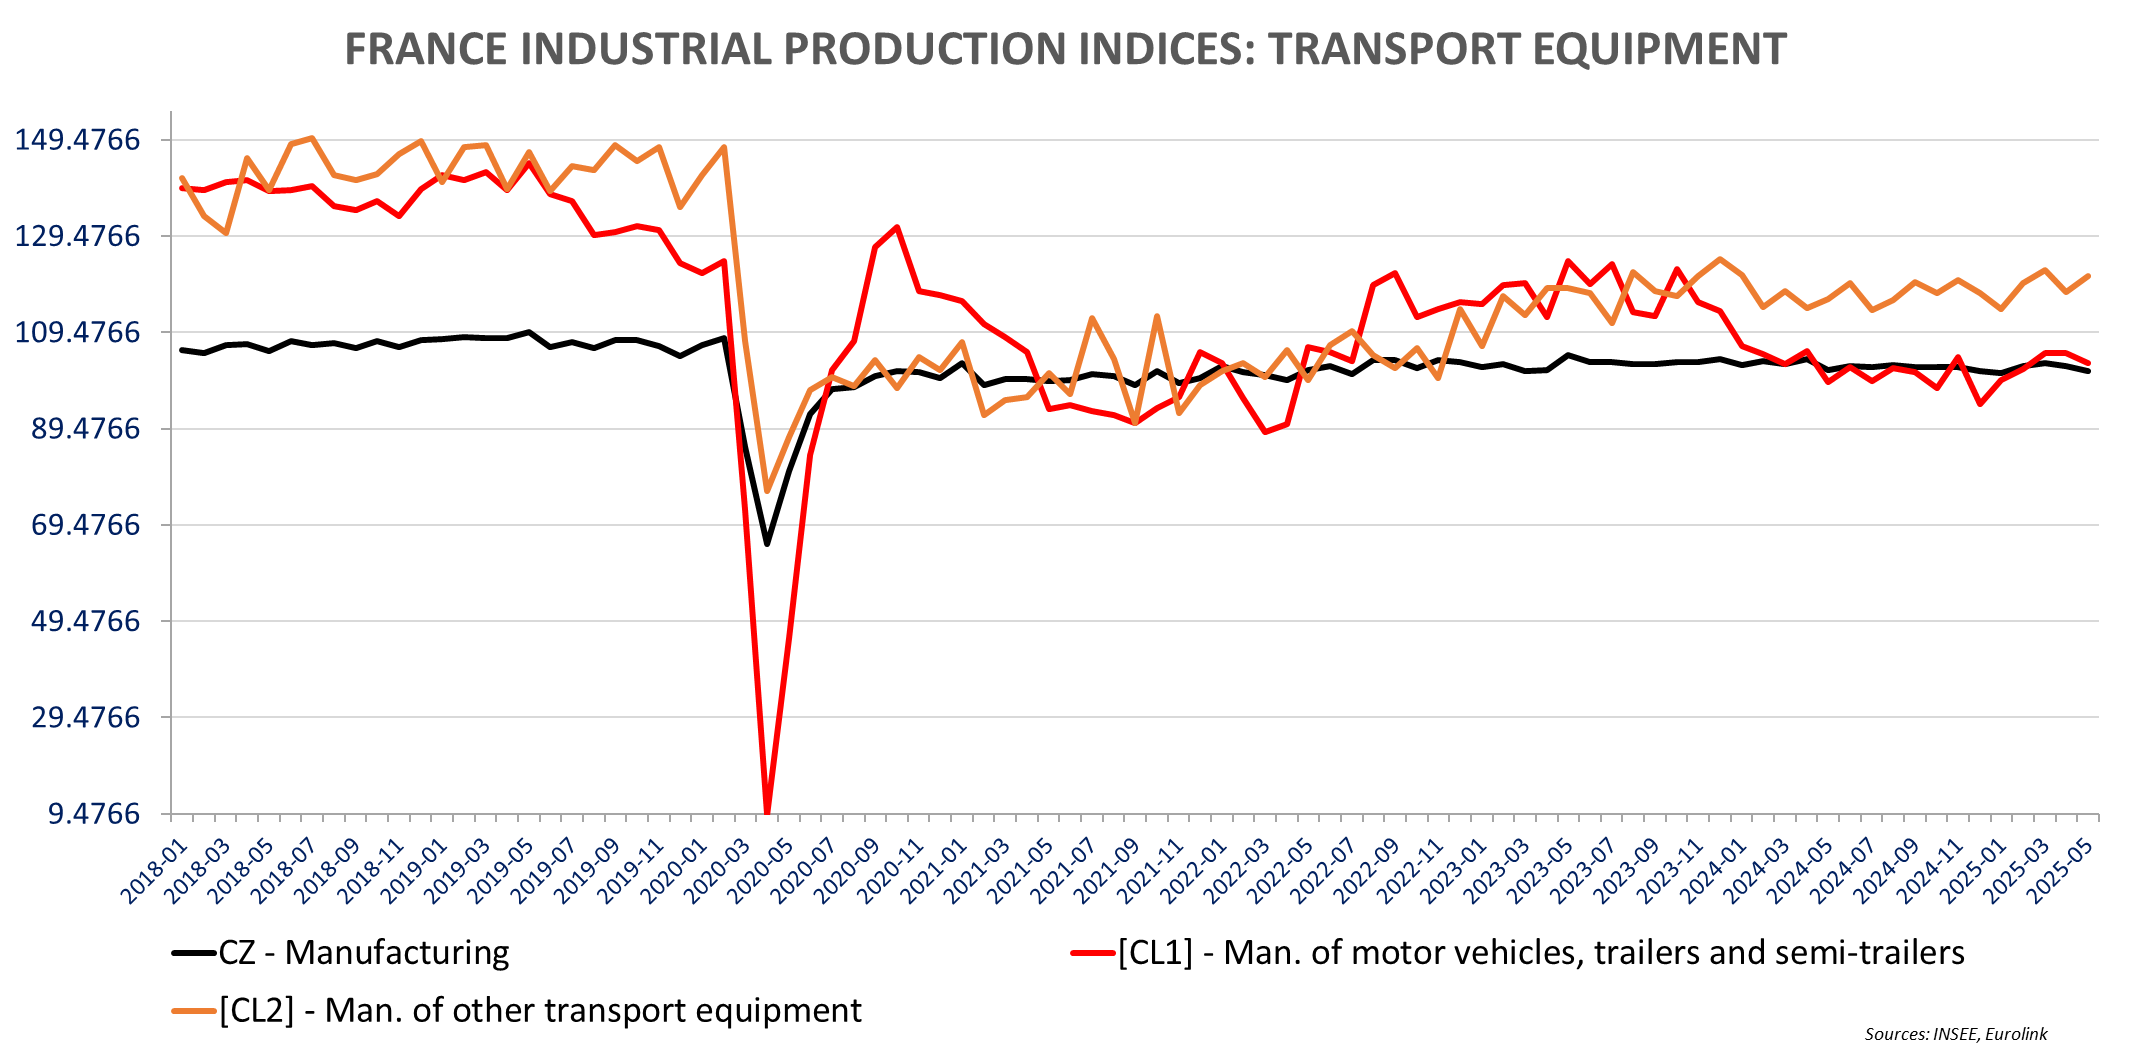
France May Production was also lower than expected, falling -0.5% m/m after -1.4% m/m in April (unrevised), when expectations were for a 0.3% m/m increase. Energy production was up 1.3% m/m in May after -6.1% m/m in April and construction decreased by -0.5% m/m. Excluding these two items, manufacturing production dropped by -1% m/m in May (-0.7% mm in April revised from -0.6%). Refinery (-6.1% m/m) was big drag on May production and capital goods production was actually up 0.2% m/m and “other” transport equipment increased 2.8% m/m. Year-over-year, production is down -0.9% yoy with energy -5.7% and construction -3.3% yoy: Manufacturing is only down -0.1% yoy improving from -1.4% yoy n April (revised from -1.6% yoy). Motor vehicles production is up 3.9% yoy now highest annual growth since October 2023 on low comparison (down -6% m/m in May 2024)
The Eurozone construction PMI is down to 45.2 from 45.6 in June (lowest in 3 months) with residential remaining the weakest segment. France weakening further to 41.6 from 43.1, Germany improving to 44.8 from 44.4 (on slower decline in commercial) and Italy slowed down (50.2 vs 50.5)
HAPPY 4th of JULY with the OBBB launch!

Tesla Eurozone: Underperformance in all major countries but France (In France and Spain Model Y outperformed, Model 3 underperformed see – past comment). Tesla has only 10.3% of EV share in the top 4 European countries. In the UK Tesla registrations are up 14.2% yoy to 7,719 vehicles in June, when the UK EV market grew +39.1% yoy
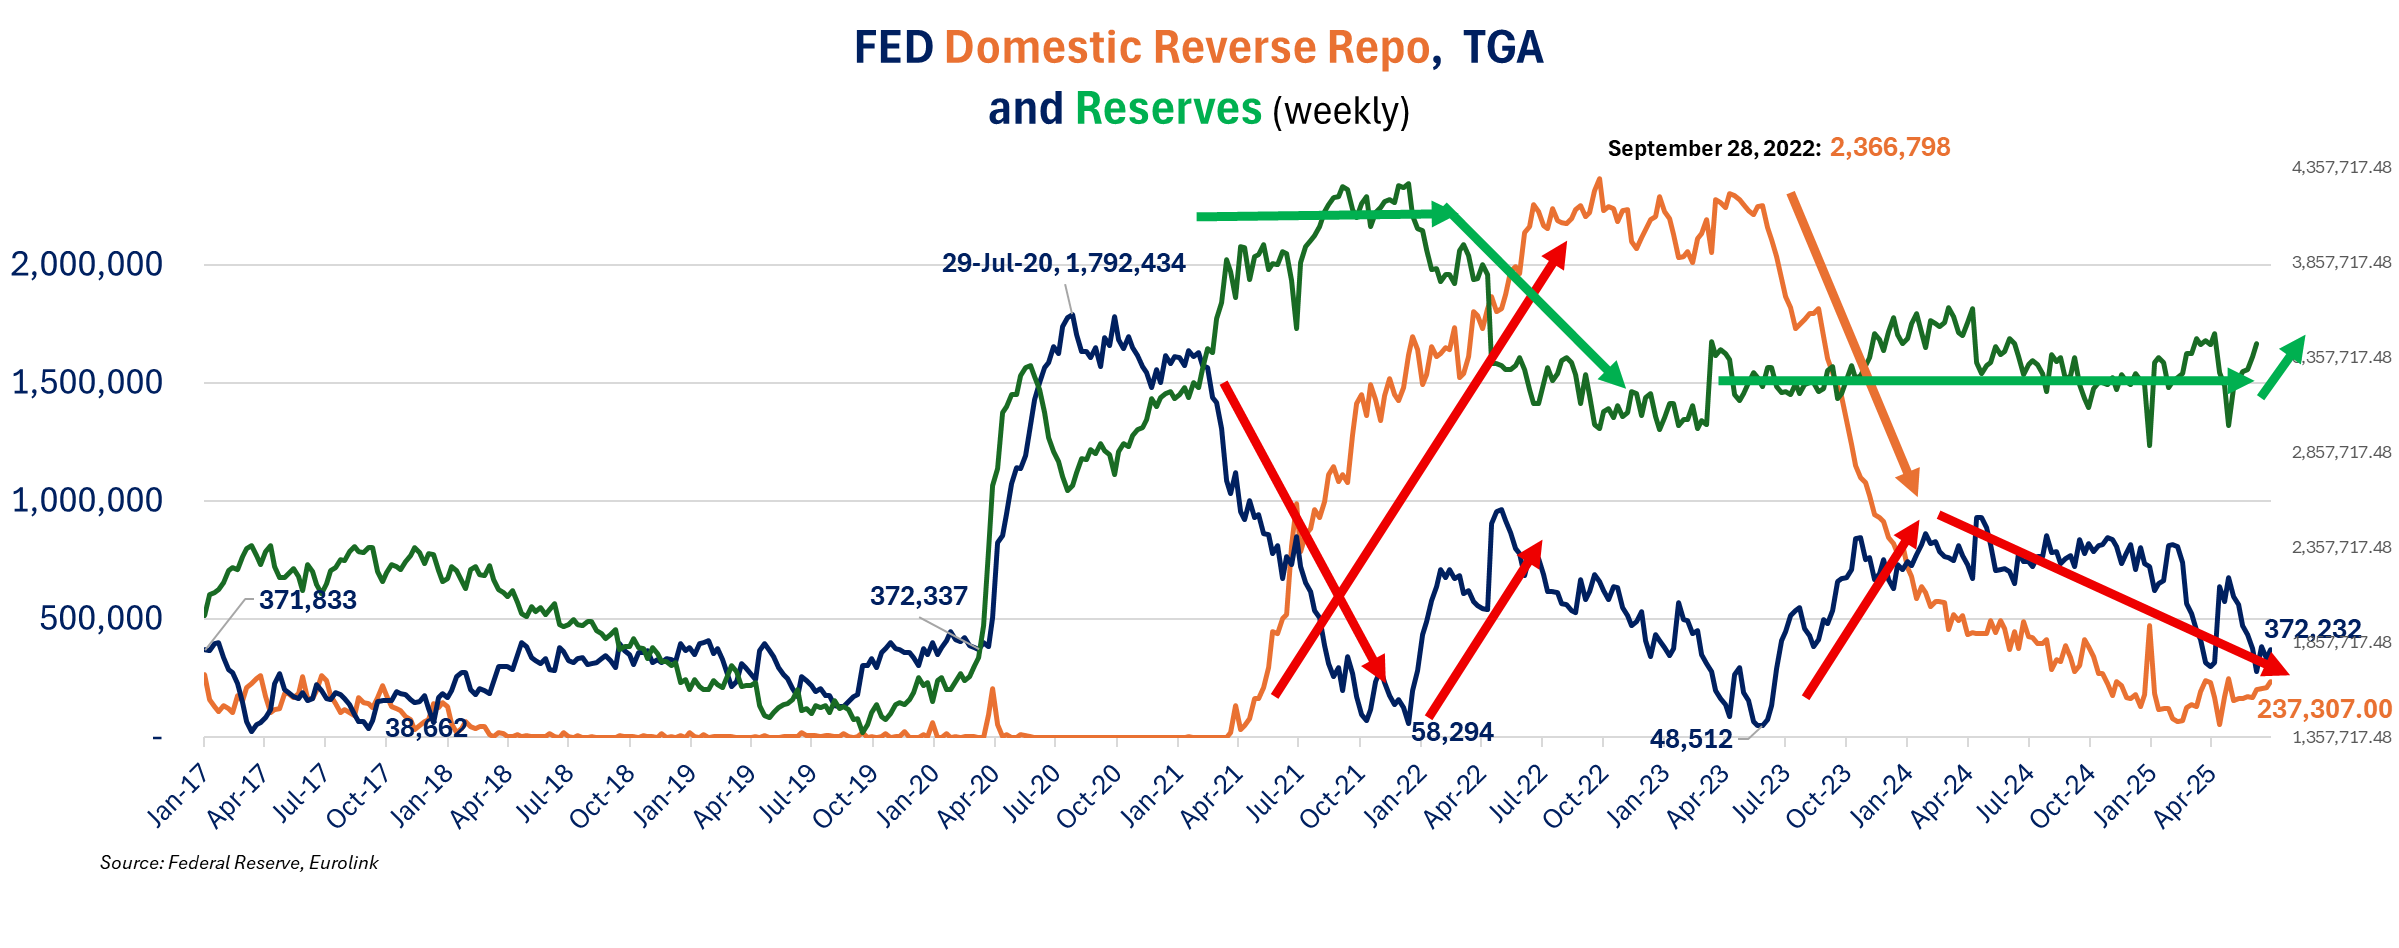
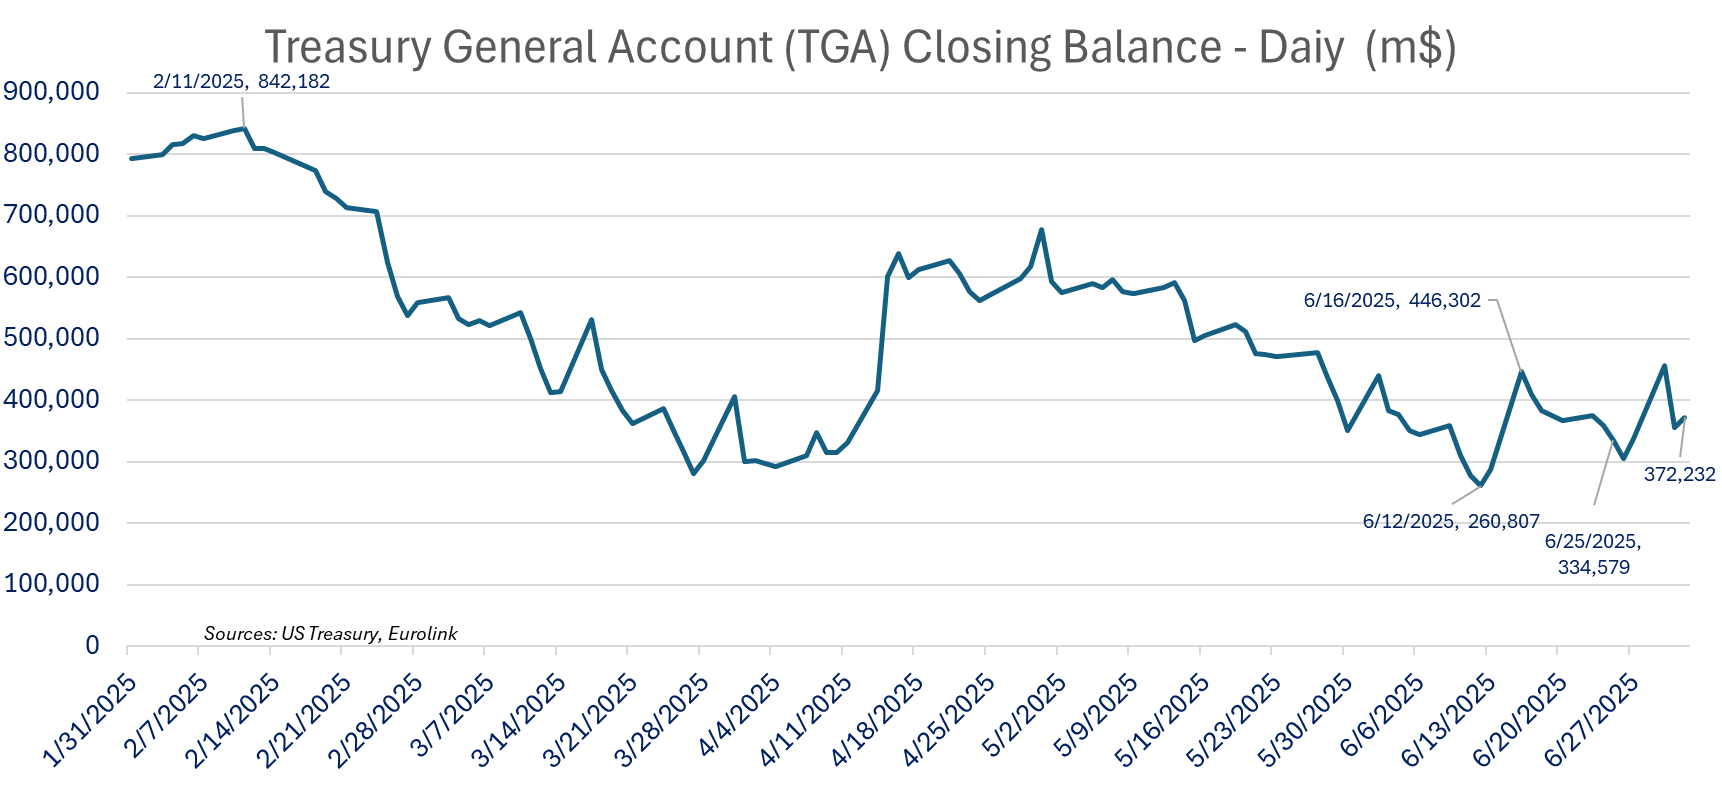
The TGA increased last week (ending July 2nd) by $37.6bn w/w to $372.2bn when a decline was expected. The Reverse Repo was still up week over week (month, quarter, half-year end), +$47.09bn w/w to $631.14bn with +$26.43bn for domestic RR to $237.31bn and +$20.66bn w/w to 393.83bn for the foreign RR.
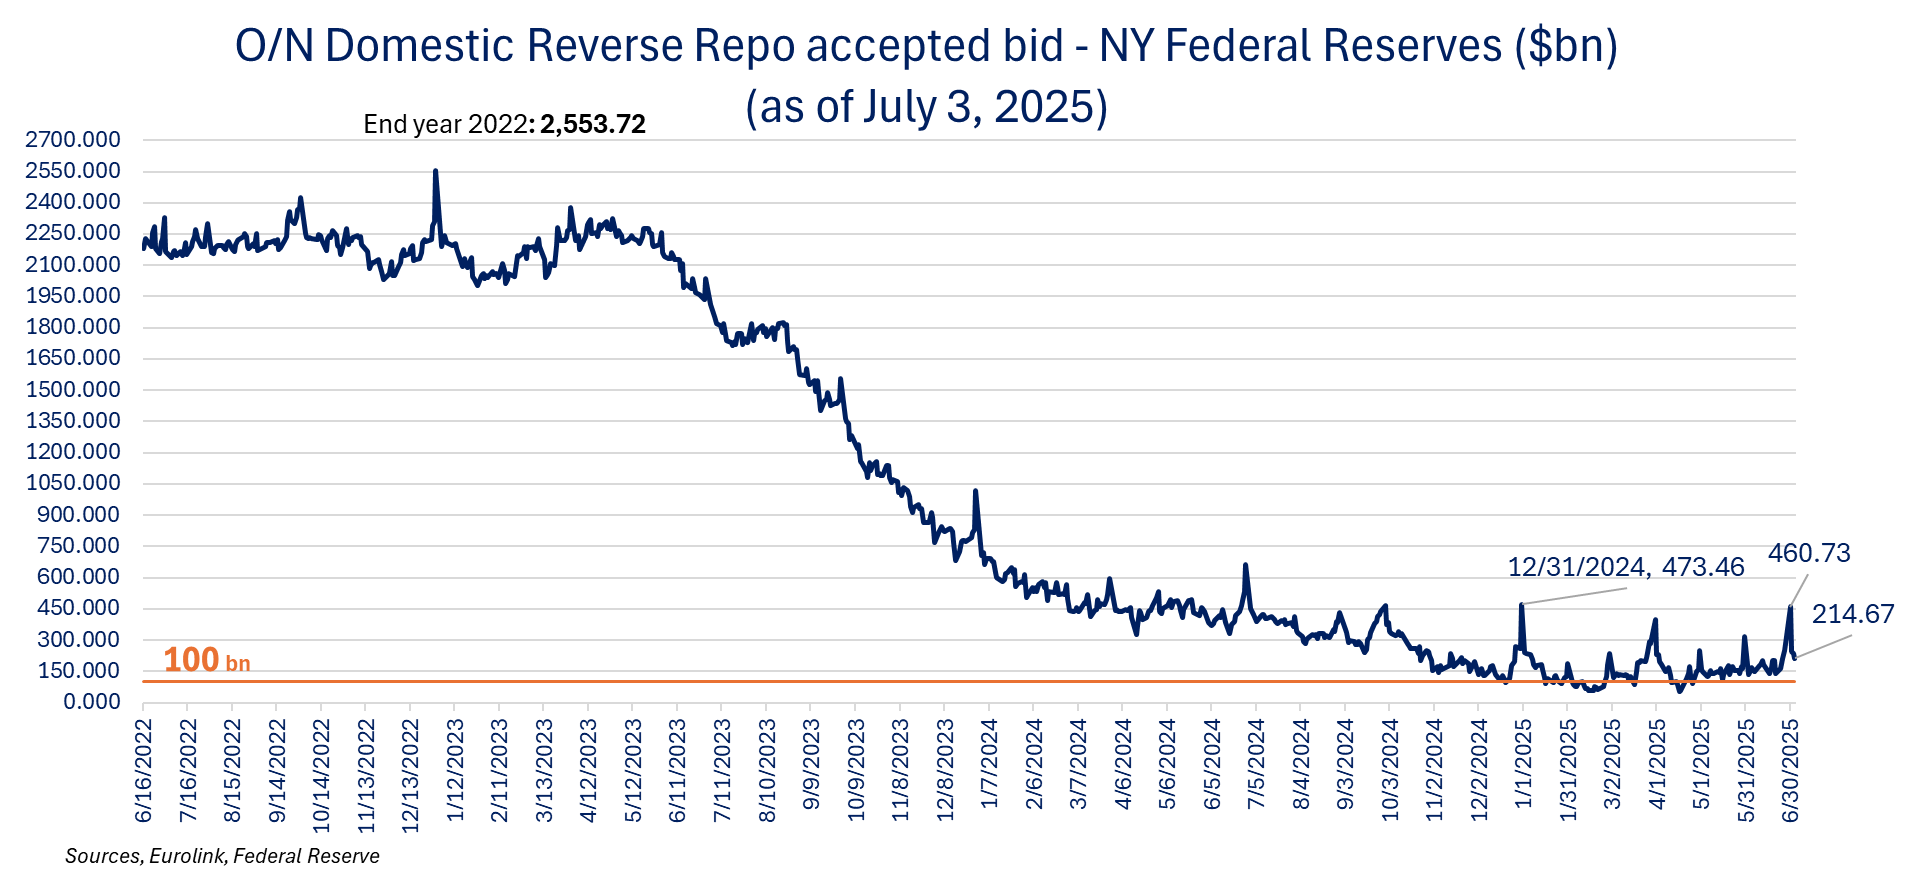
Domestic Reverse Repo increased significantly at month reaching the highest level since year end ($460.7bn on June 30 vs $473.5bn on December 31,2024) and is receding (down to 214.7bn as of July 3rd), showing some tension.
Total Assets were stable (-$2.6bn w/w). Overall, we saw a sharp decrease in Reserves (-$90.77bn) and base Money (-$84.58bn). reserves remain at ~11% of GDP.
The Fed loss increased by $4.5bn w/w (negative other liabilities and accrued dividend on the liabilities side) to -$227.1bn.
With the OBBB passed, the debt ceiling is increased by $5tn to $41.1tn, effective a month before it would have been necessary. The US treasury will start rebuilding the TGA with new net issuance in coming weeks but starting from a higher point for the TGA than expected. The TGA will decline in the coming weeks before the rebuilding restart. US Treasury Secretary Scott Bessent said yesterday that the rebuilding of the TGA will be down through T-Bill, not expecting to increase issuance of notes and bonds, expressing the belief that yields will come down with lower inflation as the Fed will end up easing.
The increase in T-bill issuance (we are still talking ~ +$500bn needed to bring the TGA to the $850bn target) will still draw down reserves and liquidity with no help from the RR (unlike in 2023).
Net Issuance will have a lesser impact on the long-end relative to the front end, but the higher deficit should still lead to steeper curves especially 10/30, but also 2/10 with more defiance for US debt and a weaker $.
Besides the TGA rebuilding the US as a lot of debt to roll over, and we have a risk to see an overburdening of the front end.
The SLR change (September) will help absorb some of the issuance and Bessent expects the growth in stable coins to support T-Bills demand, but we still see lower liquidity and reserves. Moreover, the approach exposed the US Treasury to higher inflation surprises and will undoubtedly incite the administration to increase pressure on the Fed to cut rates.
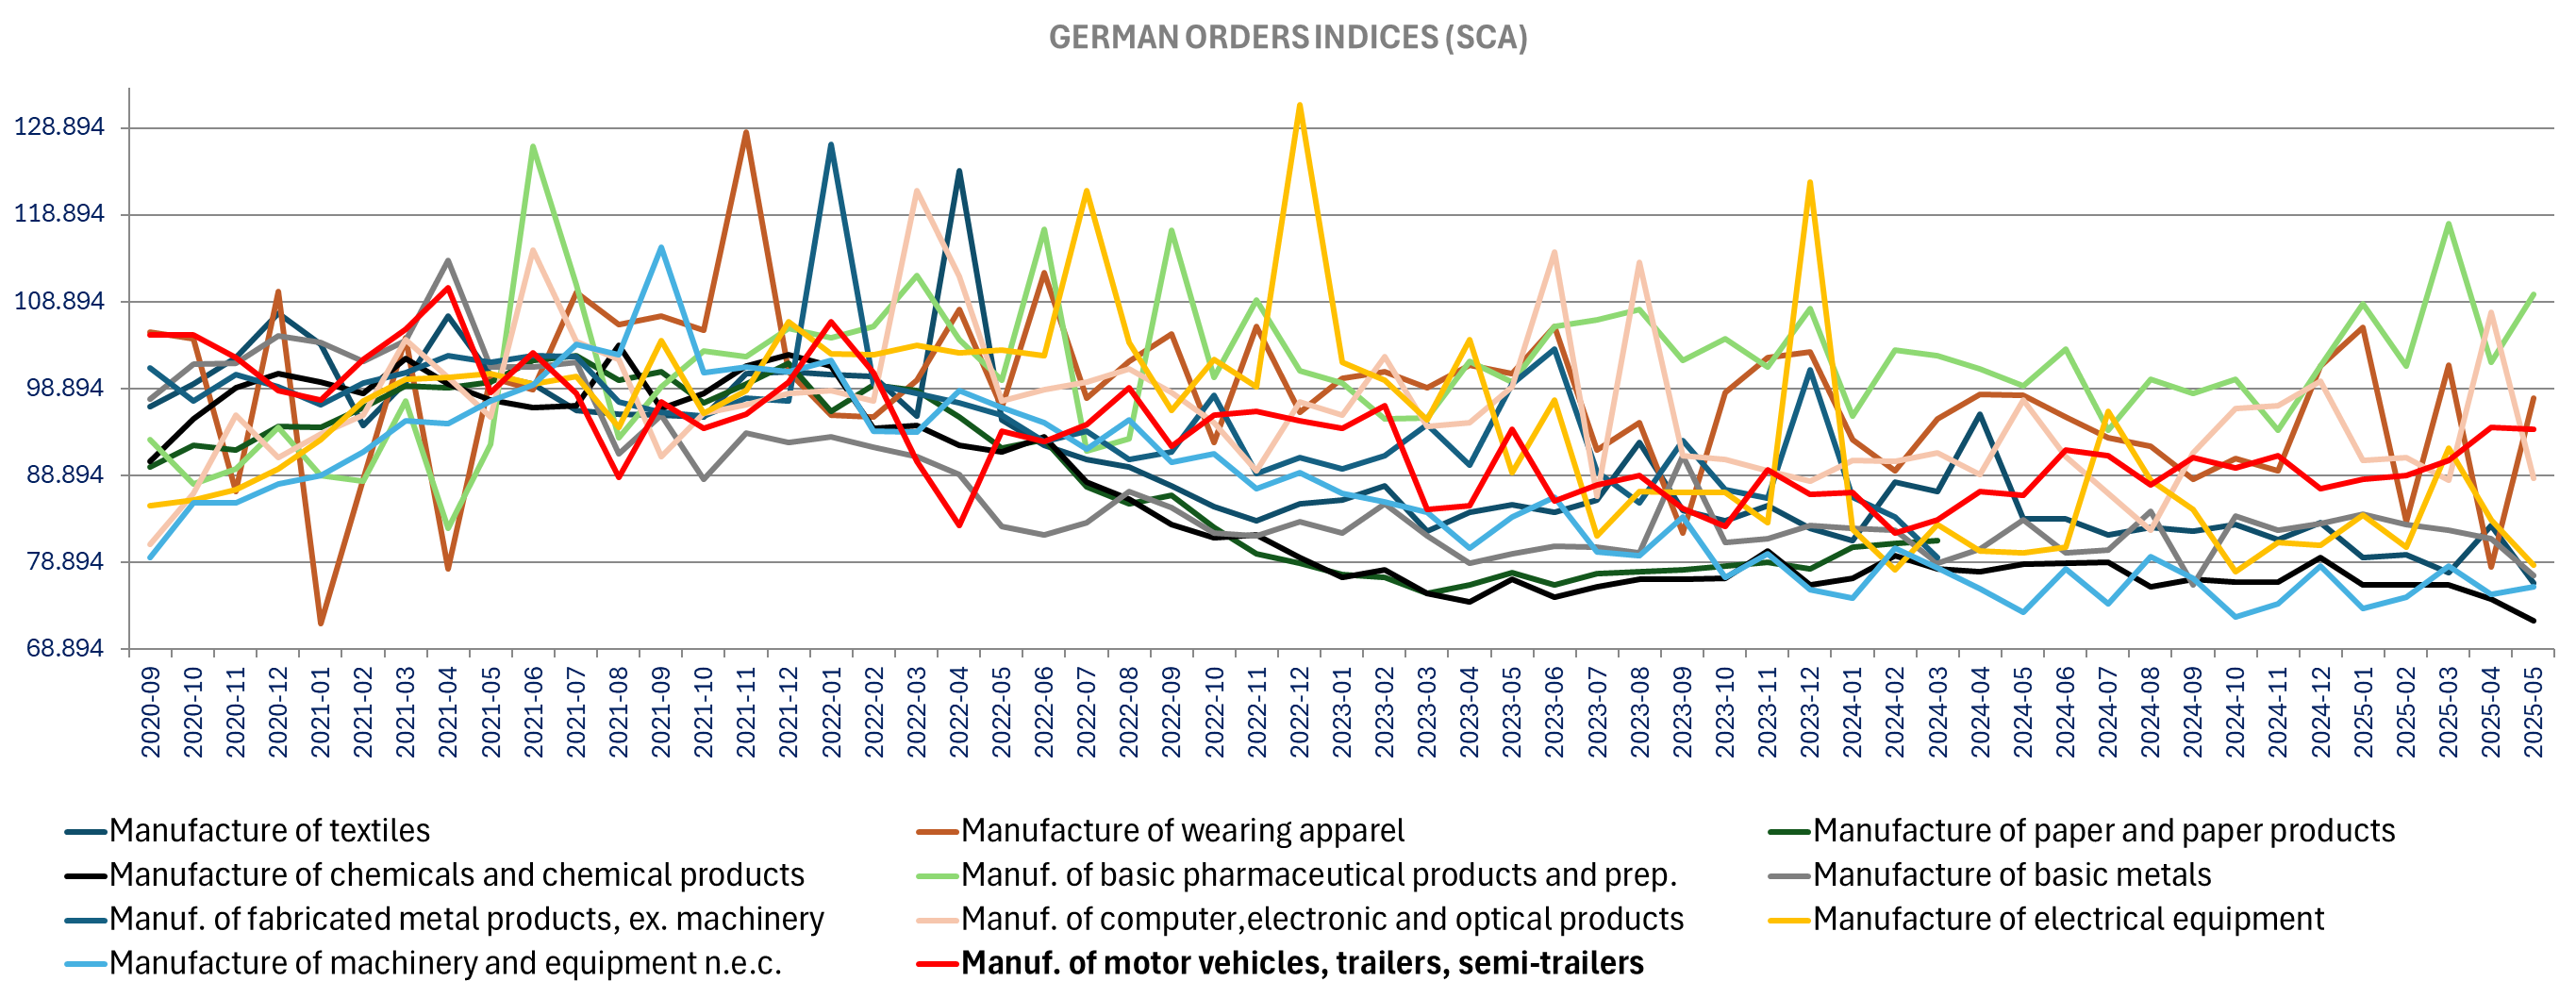
German orders are down more than economists’ expectations in May, falling -1.4% m/m vs -0.1%m/m expected but April was revised up markedly to +1.6% m/m from 0.6% m/m, making the miss less significant. That said when excluding larger orders, orders are down -3.1% m/m (with April revised to +0.9%m/m from +0.3%). All in volume seasonally and calendar adjusted.
In value orders are down -1.3% m/m (+1.2% in April revised from +0.3% m/m). Month-over-month table
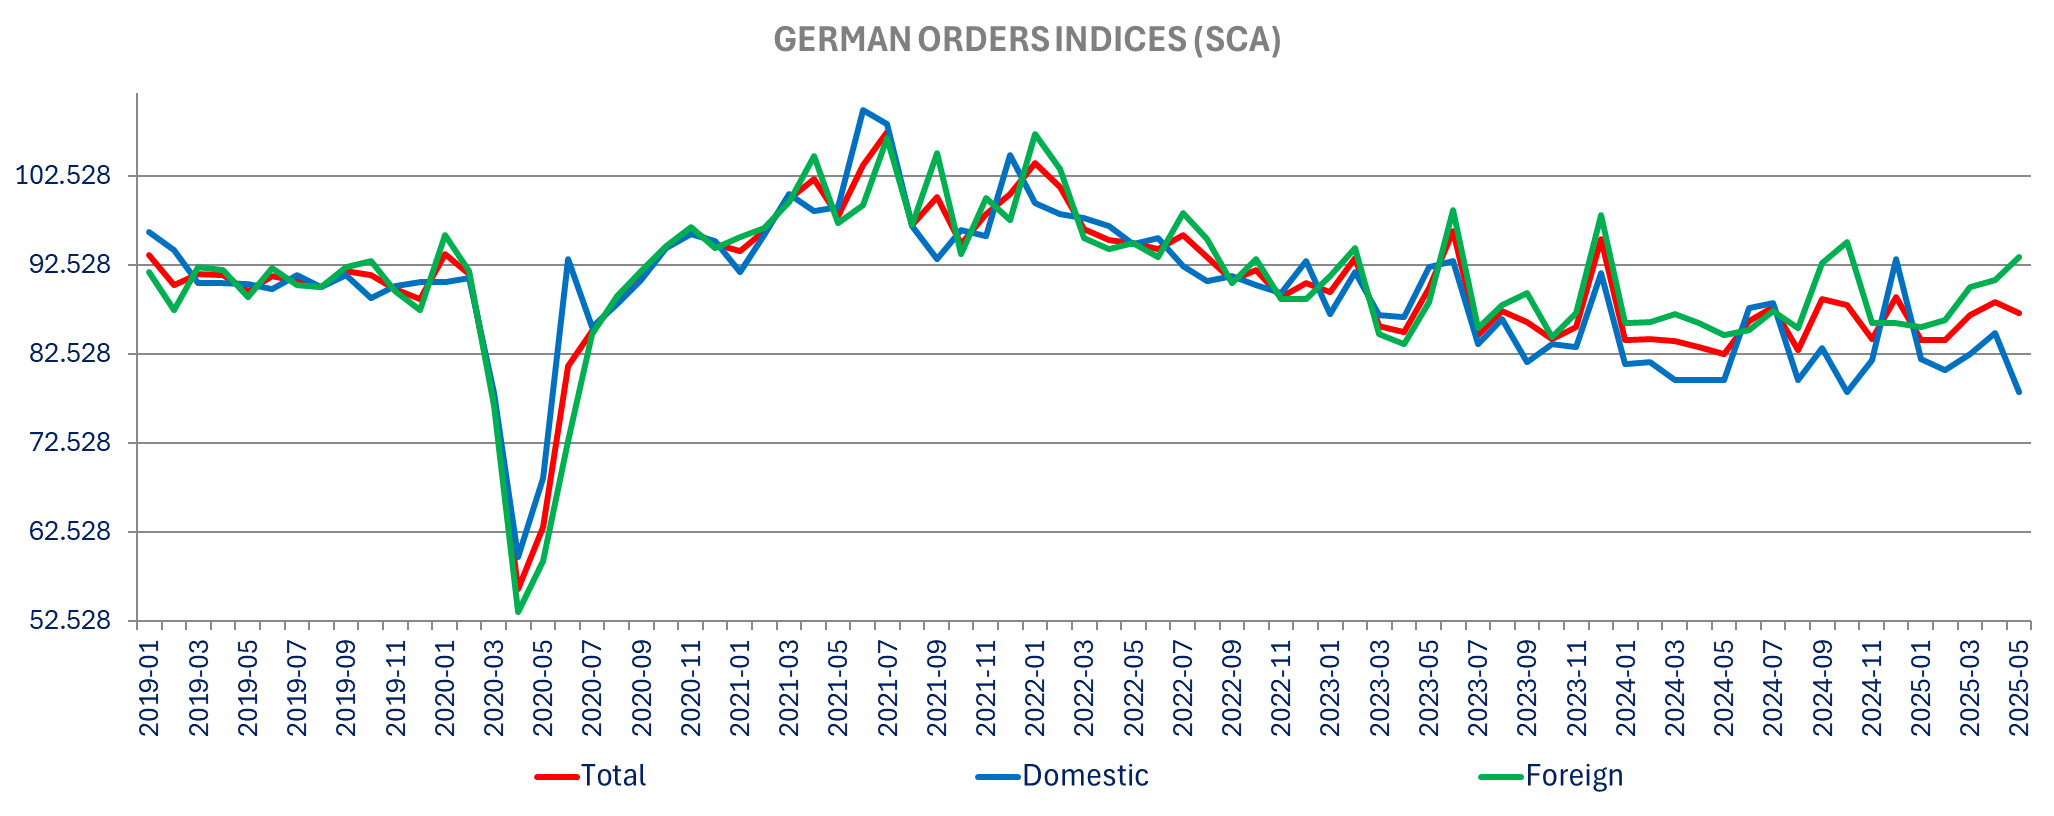
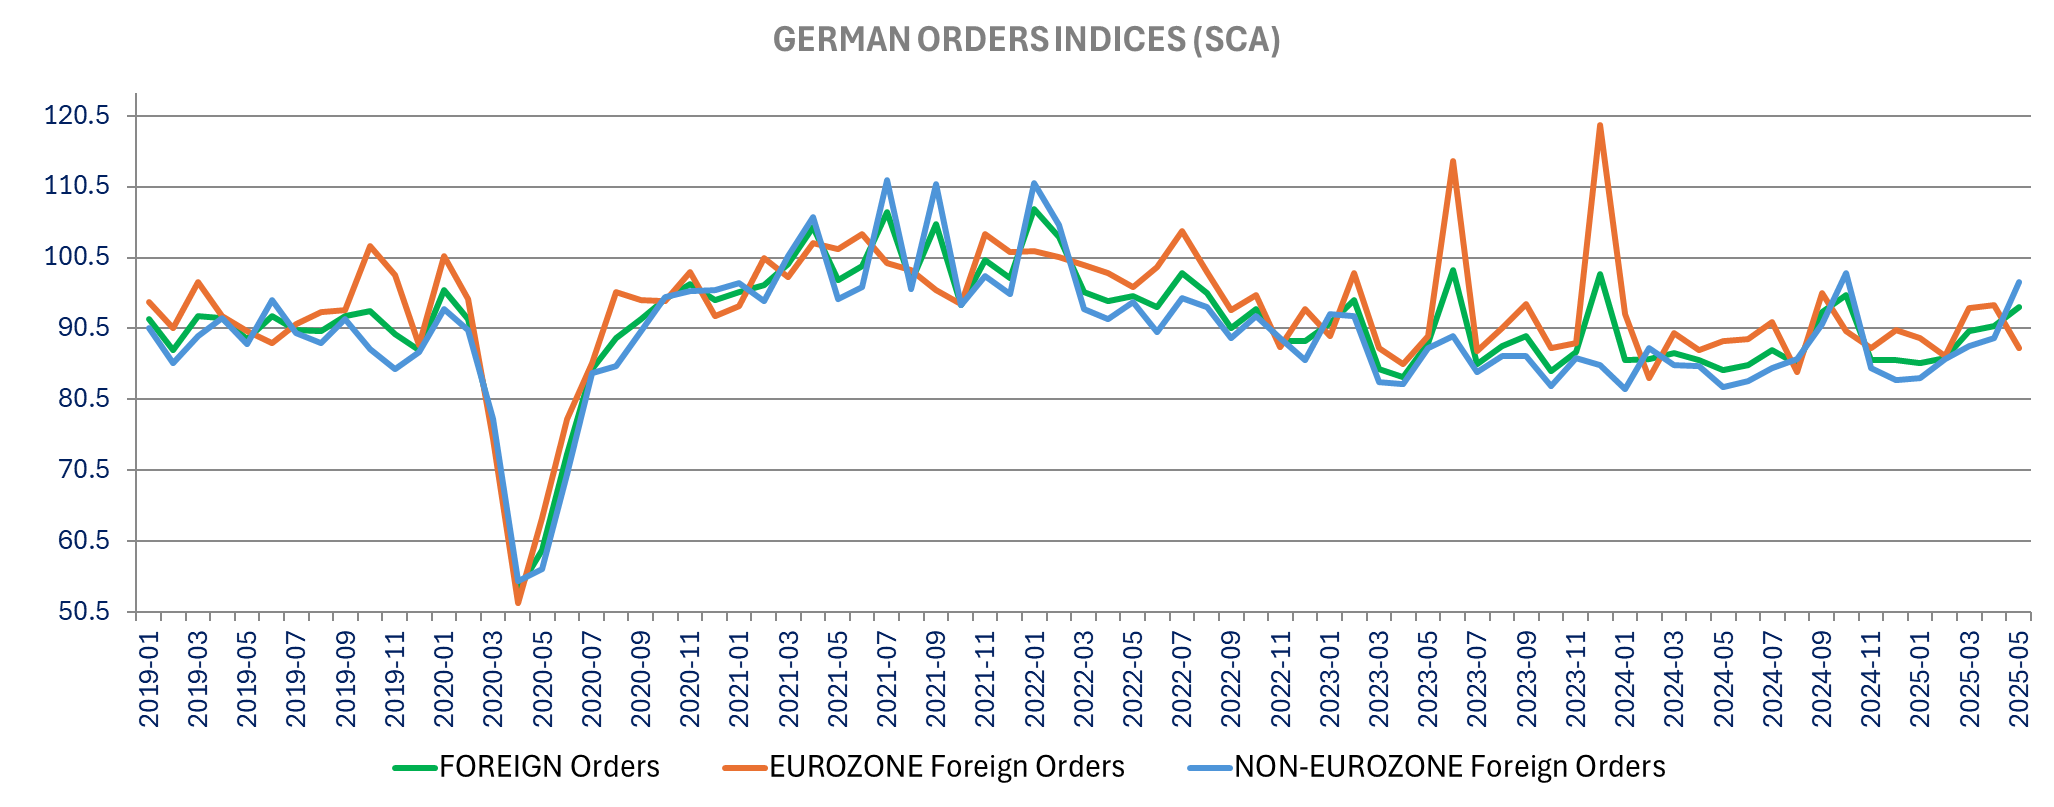
On a year-over-year basis Orders are up 5.3% in volume (-1.9% domestic, -1.5% eurozone and +18% non-Eurozone) improving from April (+ %). When excluding large orders, orders are down -3.1% yoy (-4% Eurozone and domestic)
The -1.4% decline in orders month-over-month is driven by -7.8% decline in domestic orders and -6.5% m/m decline in Eurozone orders, compensated by an increase of 9% from the non-Eurozone.
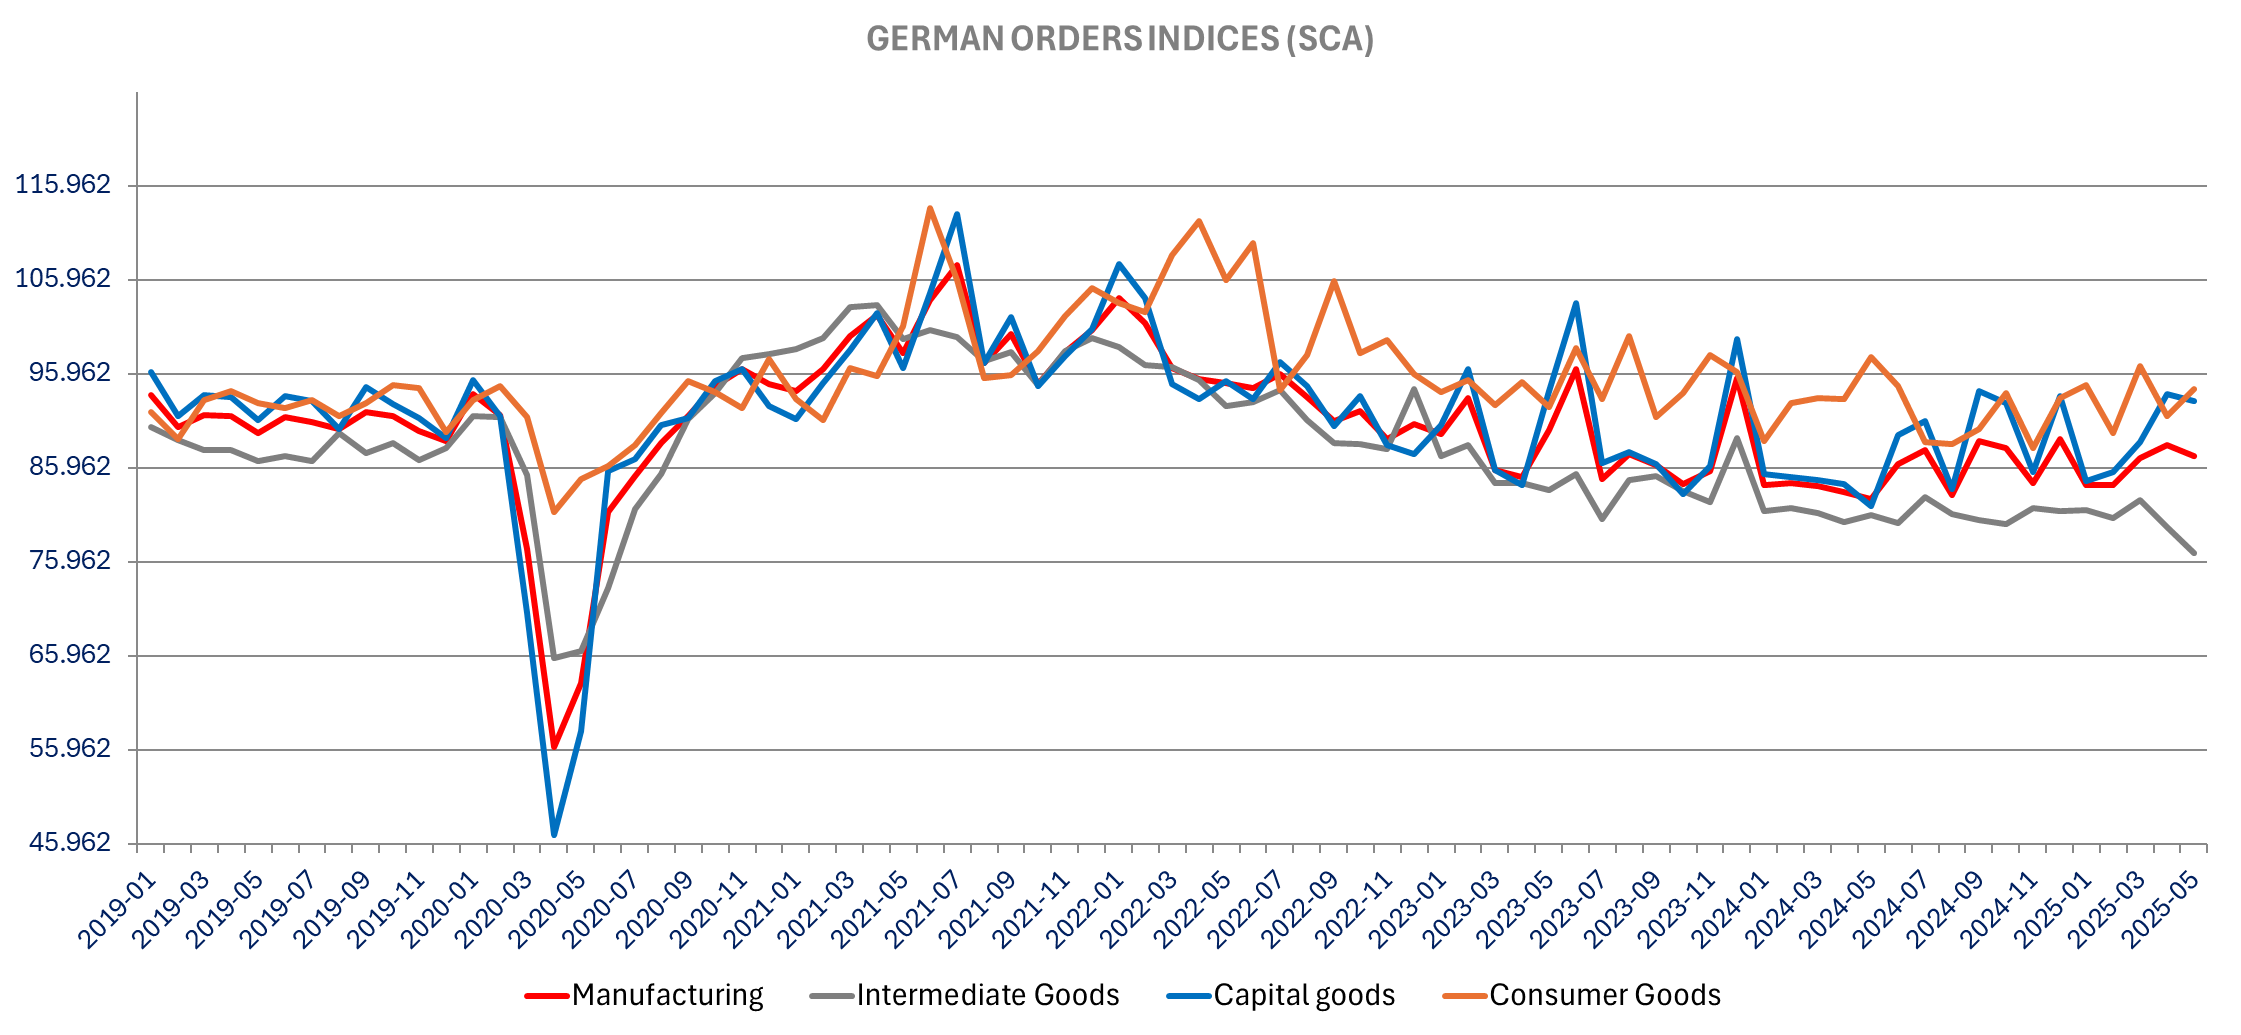
Computer & electronics orders declined -17.7% m/m after large orders in that sector in April (orders were up 21.8% m/m in April. Electrical equipment orders are down -6.2%m/m, manufacture of basic metals orders declined -5.1%, also had a negative impact on overall performance. By contrast, we saw sharp increase in new orders for the manufacture of fabricated metal products (+18.2%) and wearing apparel (24.7% after -22.8% in April) and pharmaceuticals +7.7% m/m. Interestingly “other” transport orders are up 6.8% yoy while both aircraft/space and railways equipment are down sharply m/m (-42.1% and -43.2% respectively) suggesting larger orders on the military sides (no details provided).

Monthly excluding large orders


Year-over-year – Excluding large orders

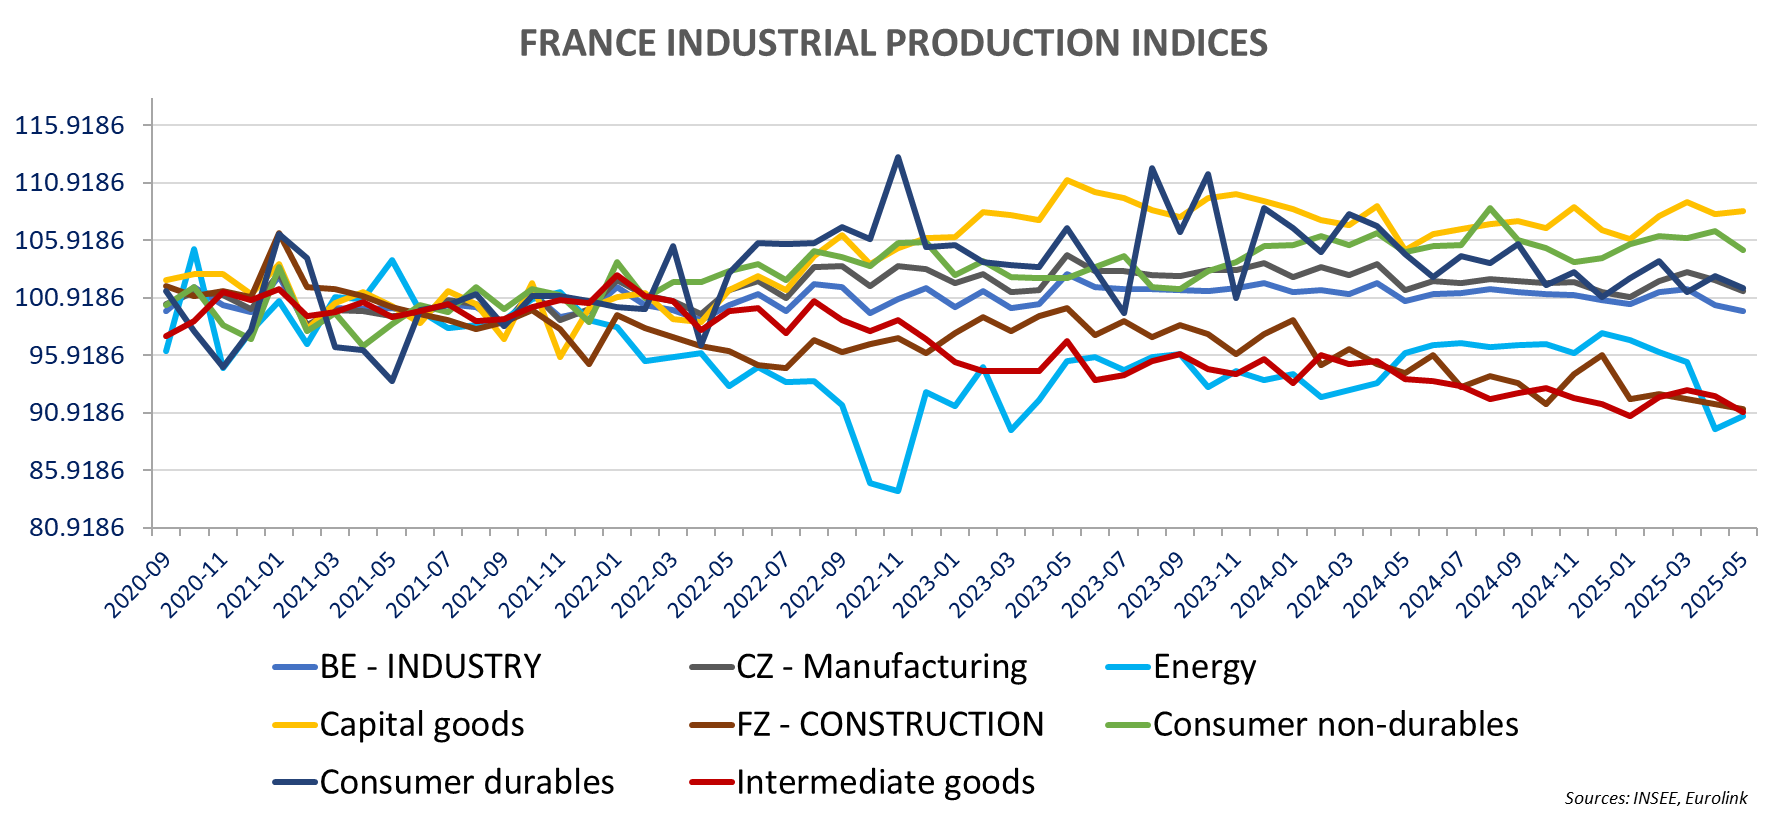
French May industrial production declined more than expected, down -0.5% m/m after -1.4% m/m in April (unrevised), when expectations were for a 0.3% m/m increase. Energy production was up 1.3% m/m in May after -6.1% m/m in April and construction decreased by -0.5% m/m. Excluding these two items, manufacturing production dropped by -1% m/m in May (-0.7% mm in April revised from -0.6%).
Year-over-year, production is down -0.9% yoy with energy -5.7% and construction -3.3% yoy: Manufacturing is only down -0.1% yoy improving from -1.4% yoy n April (revised from -1.6% yoy). Motor vehicles production is up 3.9% yoy now highest annual growth since October 2023 (down -6% m/m in May 2024)
The details show a sharp monthly decline in refinery production, down -6.1% m/m after -14.3% m/m in April. weighting down the production data along weak chemicals (-3.7% m/m after +2.6% m/m in April revised up from 1.6%). “other” transport equipment production increased by +2.8% m/m (-3.7% in April) but motor vehicles declined -2% (-0.1% in April).
Food production declined -0.6%m/m, Textiles, apparels & leather goods -0.3% m/m and machinery & equipment -0.8%. Computer and electronics was among the weakest, with production down -3.7%. Wood/paper production is slightly up (+0.3% m/m) but other intermediary goods are down (rubber & plastic -1.5%, base metals -2.2%. Pharmaceuticals also fell -2.2%.
Overall intermediate goods are down -1.6% and consumer non-durable also down -1.6%. Consumer durable goods declined by -1% m/m, but capital goods increased +0.2% m/m (with April revised up to -0.9% from -1.1%).


EUROZONE CAR REGISTRATIONS: TOP 4
With German registrations out (256,193vehicles, down -13.8% yoy in June and down -4.7% yoy ytd) we have the Top-4 Eurozone countries. As Spain is still up +13.9%, the Top 4 Registrations are only down -8.8% yoy in June and down -2.6% yoy ytd. On a year-to-date basis PHEV saw the strongest growth in the Top-4, up 29.7% yoy to 288,817 cars (share of 7.8% up 1.9points yoy), followed by EV, up 21.3% yoy to 488,302 vehicles (share of 13.2% up 2.6 points). The largest market remains HEV, with 1,407,905 cars sold year-to-date, up 19.4% yoy with a share if 38% up 7 points yoy, a bigger share than Diesel and Petrol engines combined (37.2%). See tables below

Tesla Eurozone: Underperformance in all major countries but France (In France and Spain Model Y outperformed, Model 3 underperformed see – past comment). Tesla has only 10.3% of EV share in the top 4 European countries. In the UK Tesla registrations are up 14.2% yoy to 7,719 vehicles in June, when the UK EV market grew +39.1% yoy
See details for June registrations published earlier for France, Italy and Spain


Good UK registrations in June, up 6.7% yoy to 191,316 vehicles, the best June since 2021. The 6months registrations reached 1,042,219 cars, up 3.5% and the best first half of since 2019.
EV sales are up 39.1% yoy in Jin and up 34.6% yoy ytd
The SMMT, Breakdown between Gasoline, Diesel and HEV is not the same as for the ACEA (different allocation for soft hybrid)
SMMT engine breakdown:
n/a

SECTOR PERFORMANCE
Relative performance to STOXX 600
Today’s Performance
Versus early hours:

Indices

Versus early hours

Commodities

DISCLAIMER
This material is provided by Eurolink Securities L.L.C. for information purposes only and is not intended as a recommendation or an offer or solicitation for the purchase or sale of any security or financial instrument. The opinions, forecasts, facts, and recommendations contained here are based upon the information available as of the date of the report. The analysts are basing their opinions upon information they have received from sources they believe to be accurate and reliable. The report is directed exclusively at Institutional Investors who make their own decisions regardless of the present publication or opinions reflected within the report. This material is not a complete analysis of all material facts respecting any issuer, industry, or security or of your investment objectives, parameters, needs or financial situation, and therefore is not a sufficient basis alone on which to base an investment decision. A guarantee of completeness and accuracy of the information in this report is not assumed by Eurolink Securities LLC and any liability arising from the use of this report is excluded and disclaimed. The information contained herein is as of the date and time referenced above. Opinions and recommendations are subject to change without notice. Eurolink Securities L.L.C. has any obligation to update such information. Past performance is not indicative of future results. The investments discussed may fluctuate in price or value. Changes in rates of exchange may have an adverse effect on the value of investments. Transactions involving the financial instruments mentioned herein may not be suitable for all investors. Eurolink Securities L.L.C. has no obligation to continue to provide this research product and no such obligation is implied or guaranteed. The distribution rights of this report belong solely to Eurolink Securities L.L.C. It is prohibited to publish or to give this report or parts to third parties. No parts of it may be reproduced, resold, stored, or transmitted in any printed, electronic, or other form, or used for generating or marketing any printed or electronic publication, service, or product without Eurolink Securities LLC’s previous approval.