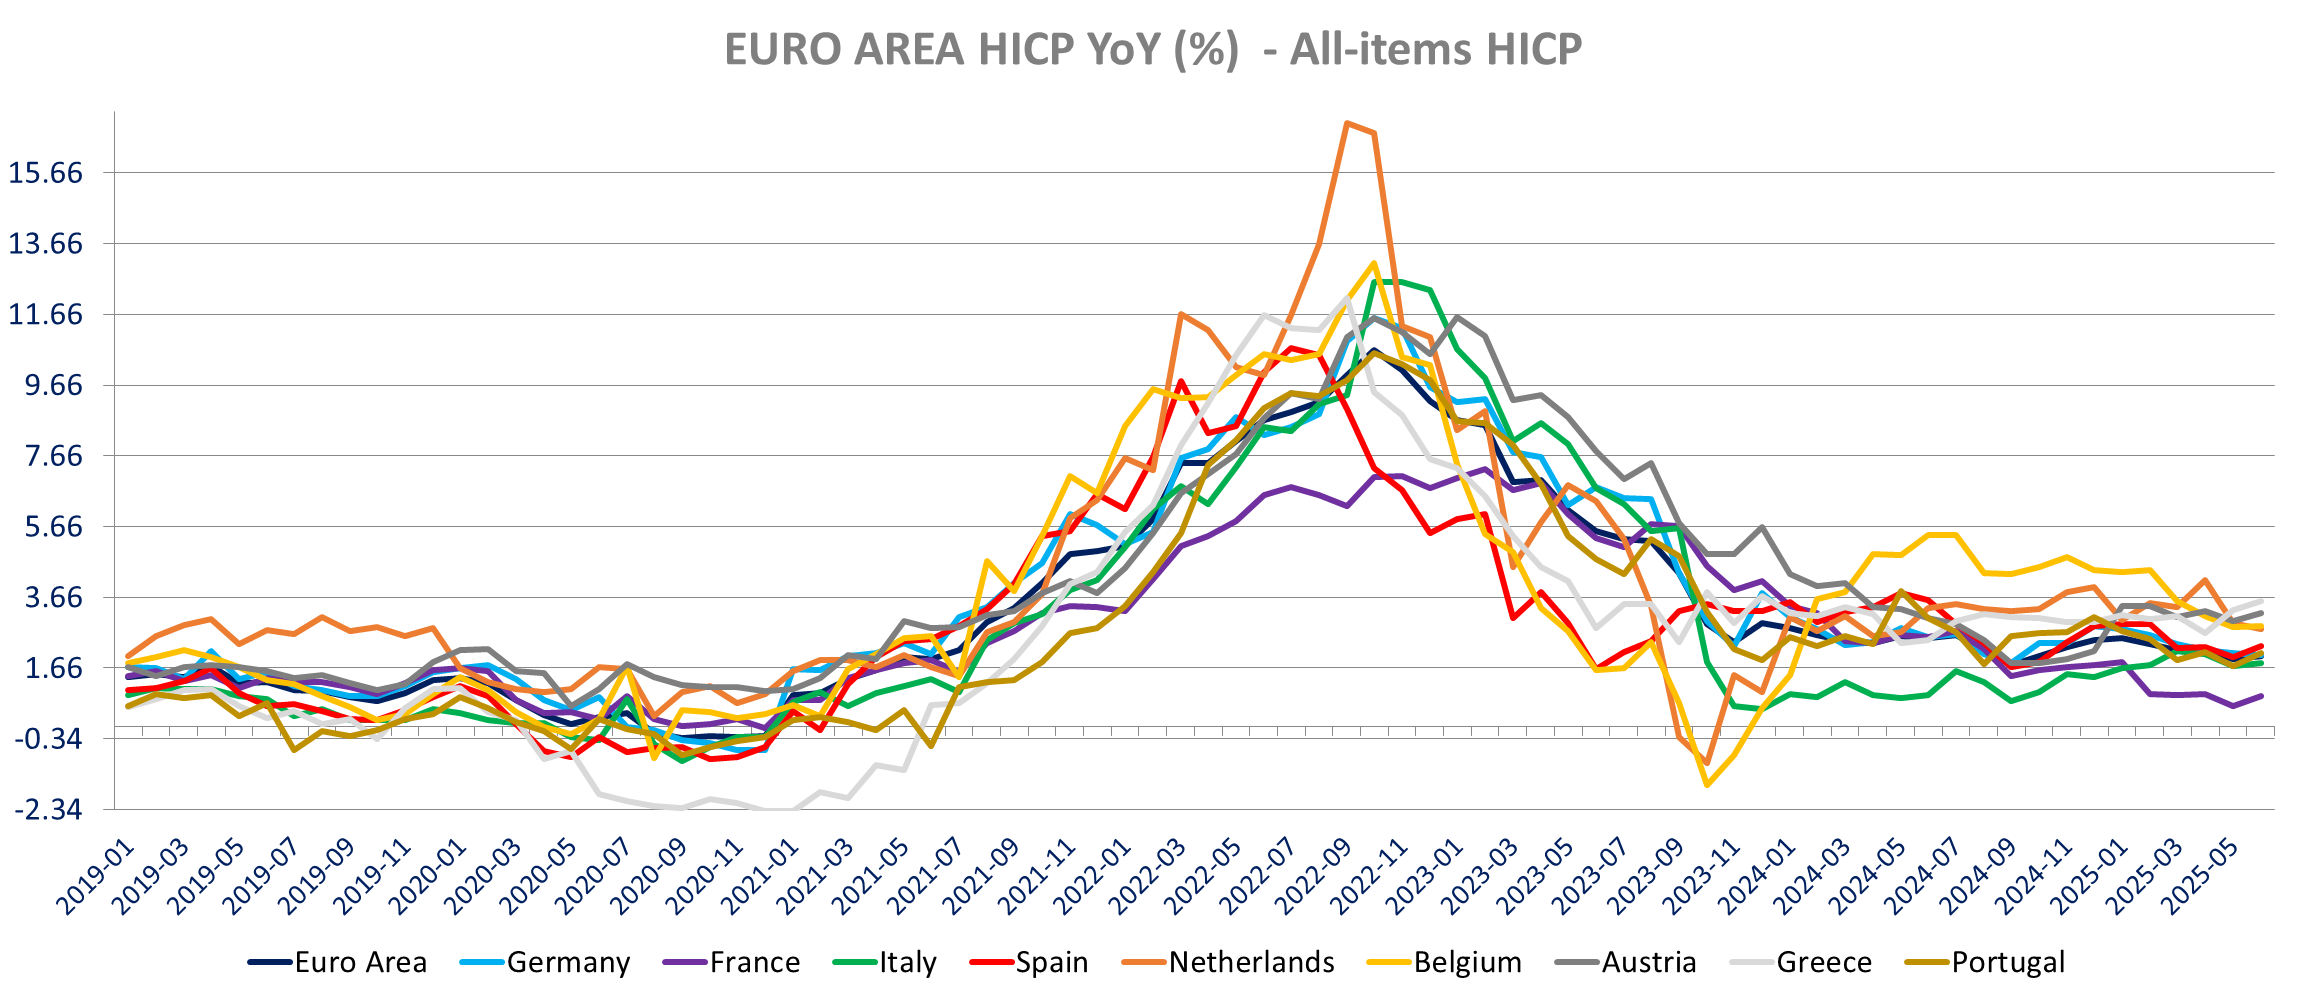
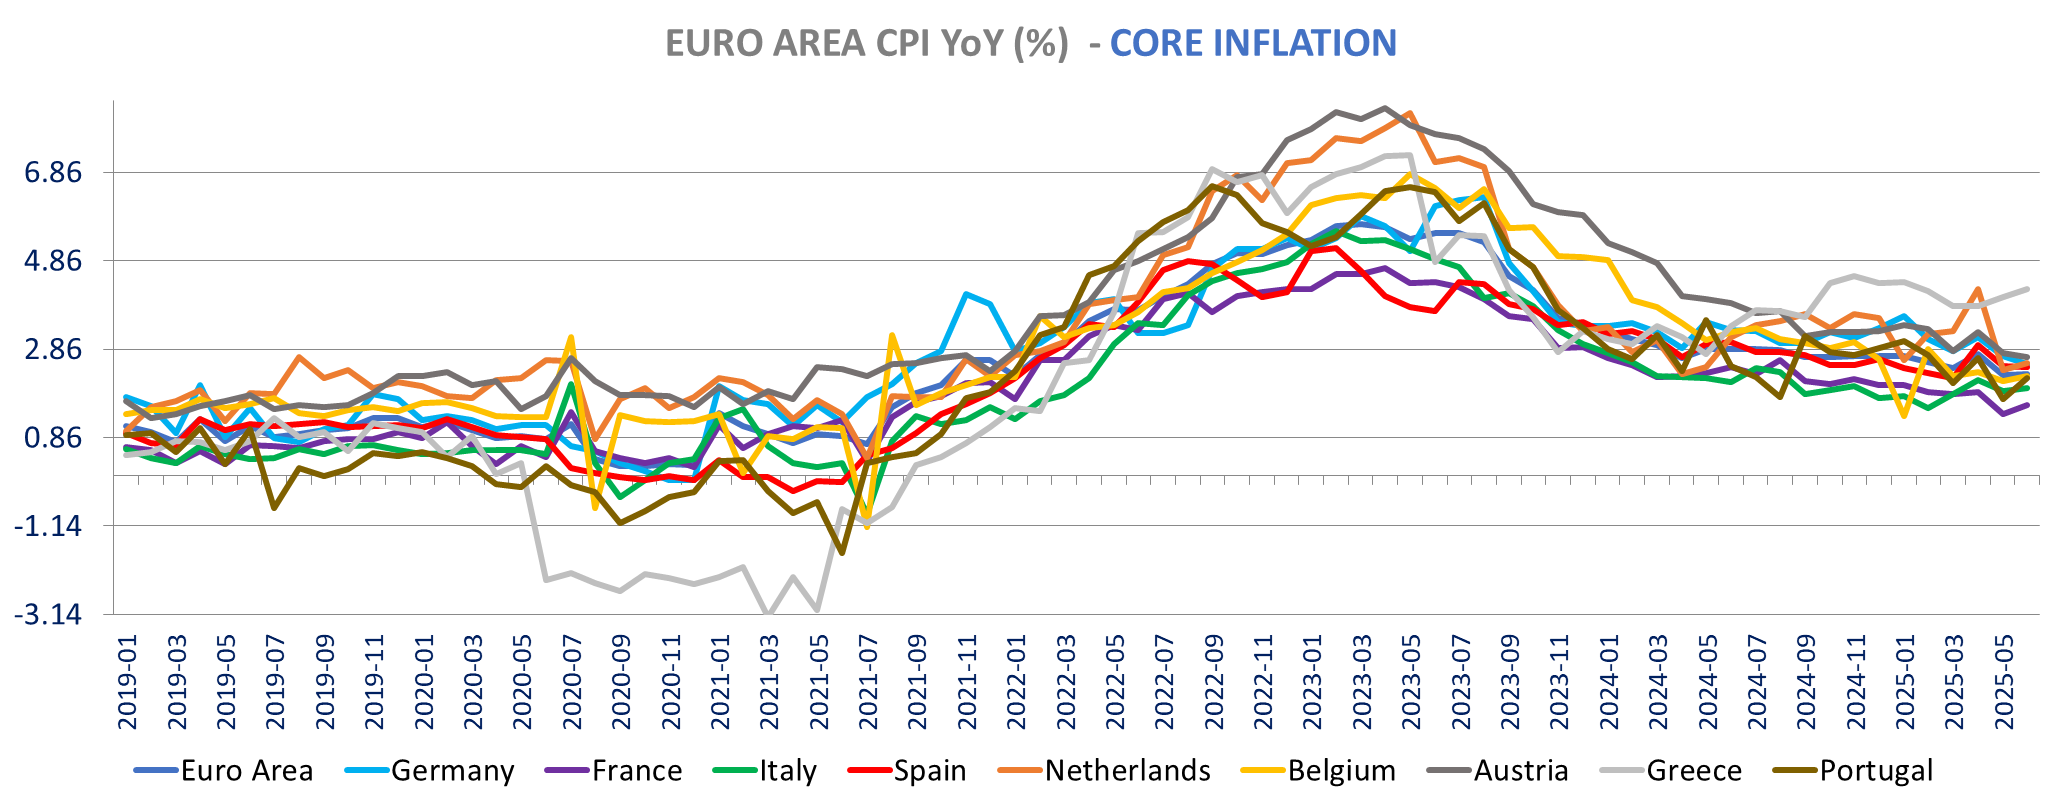
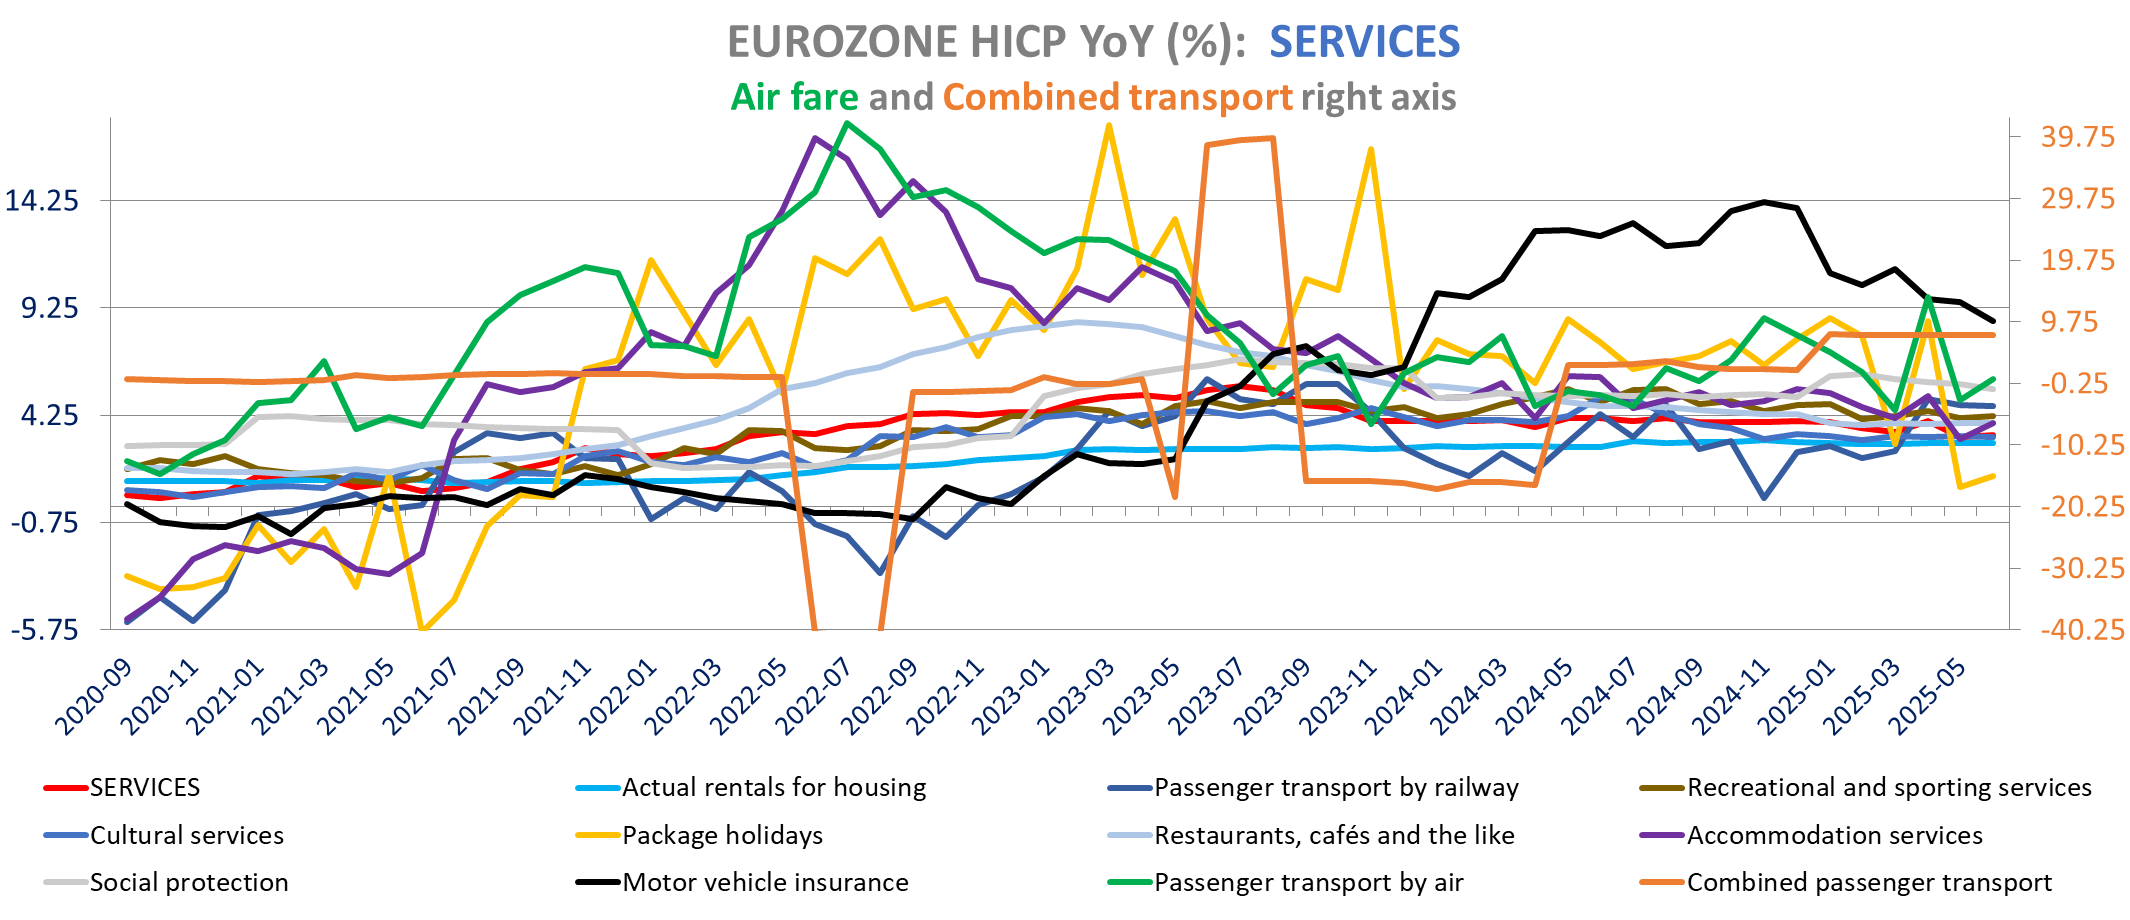
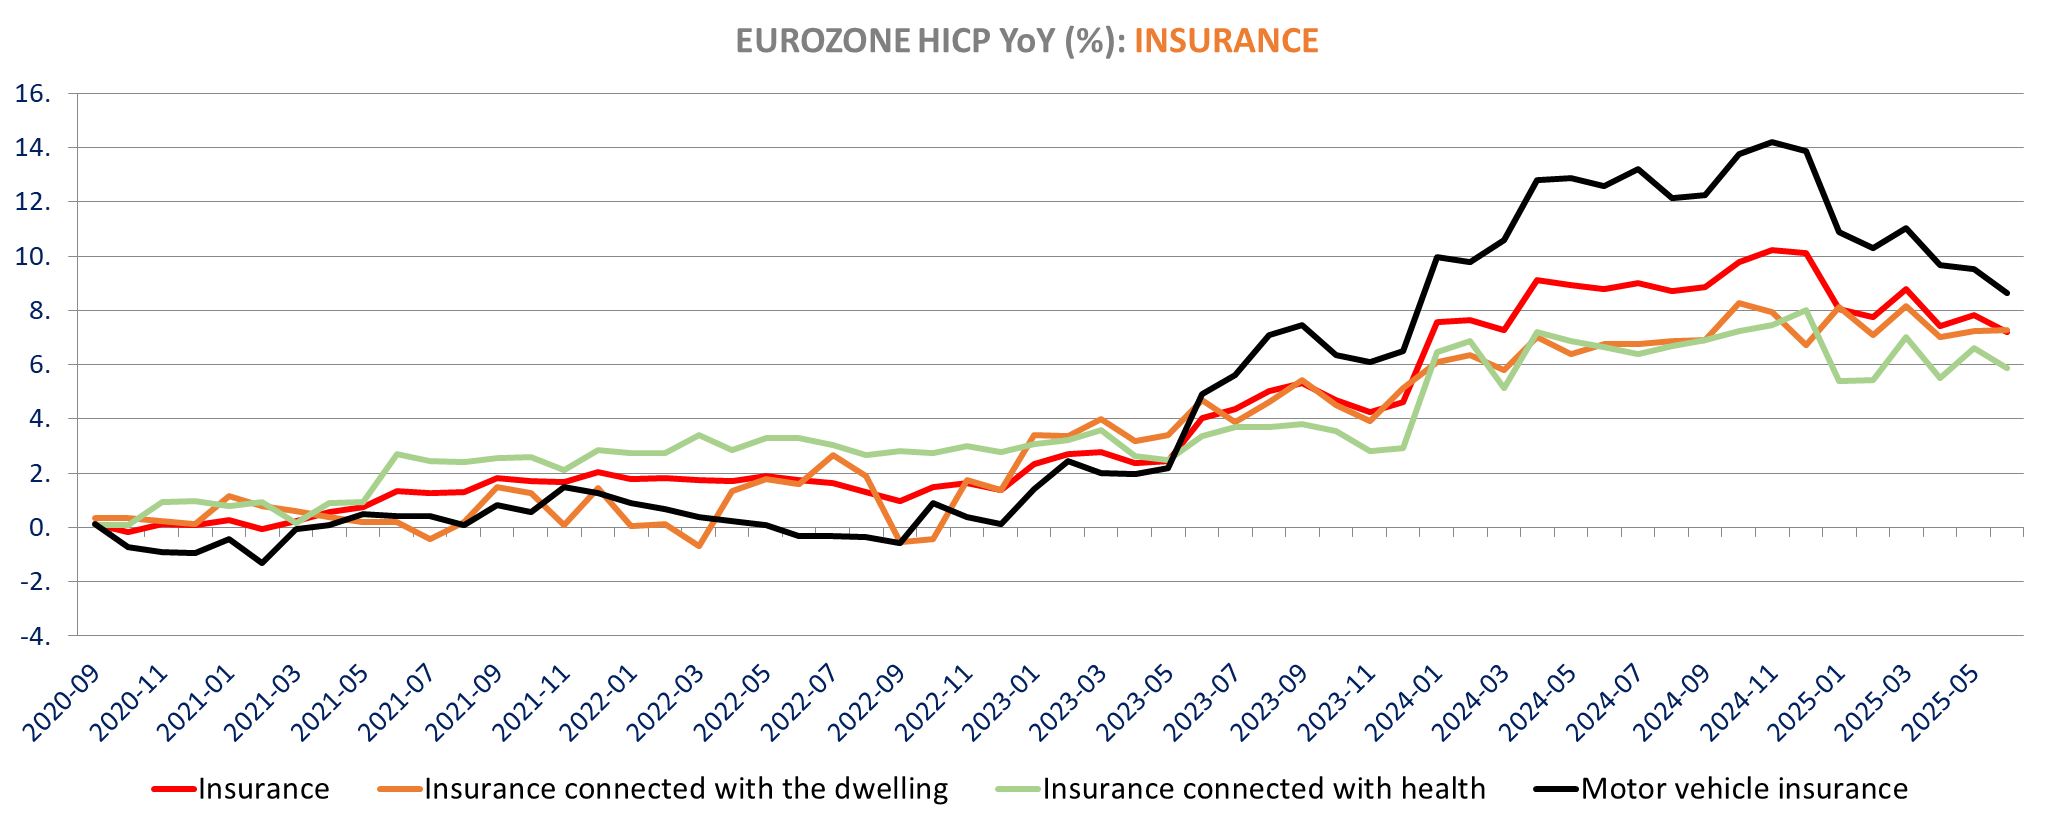
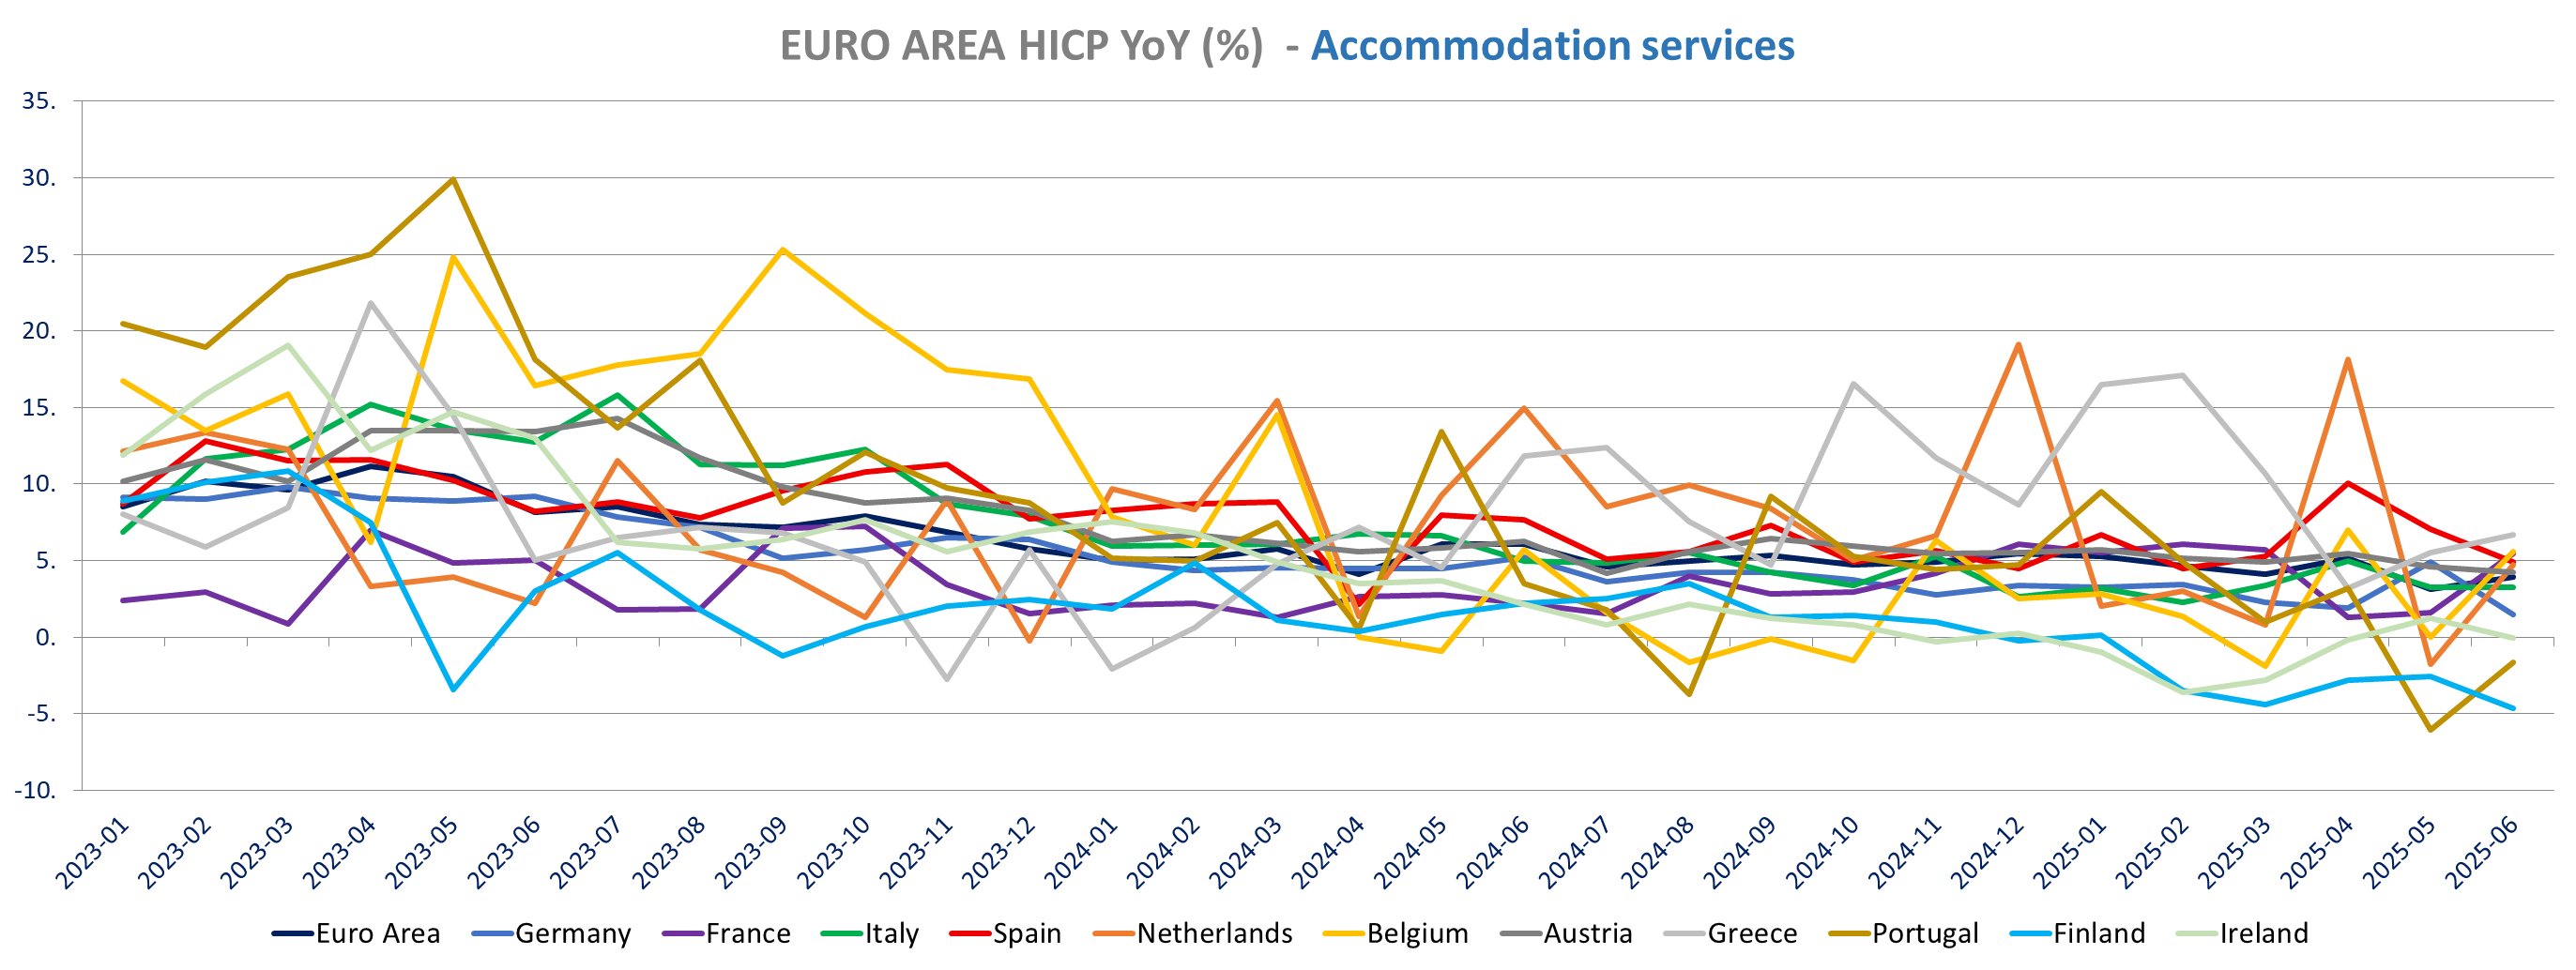
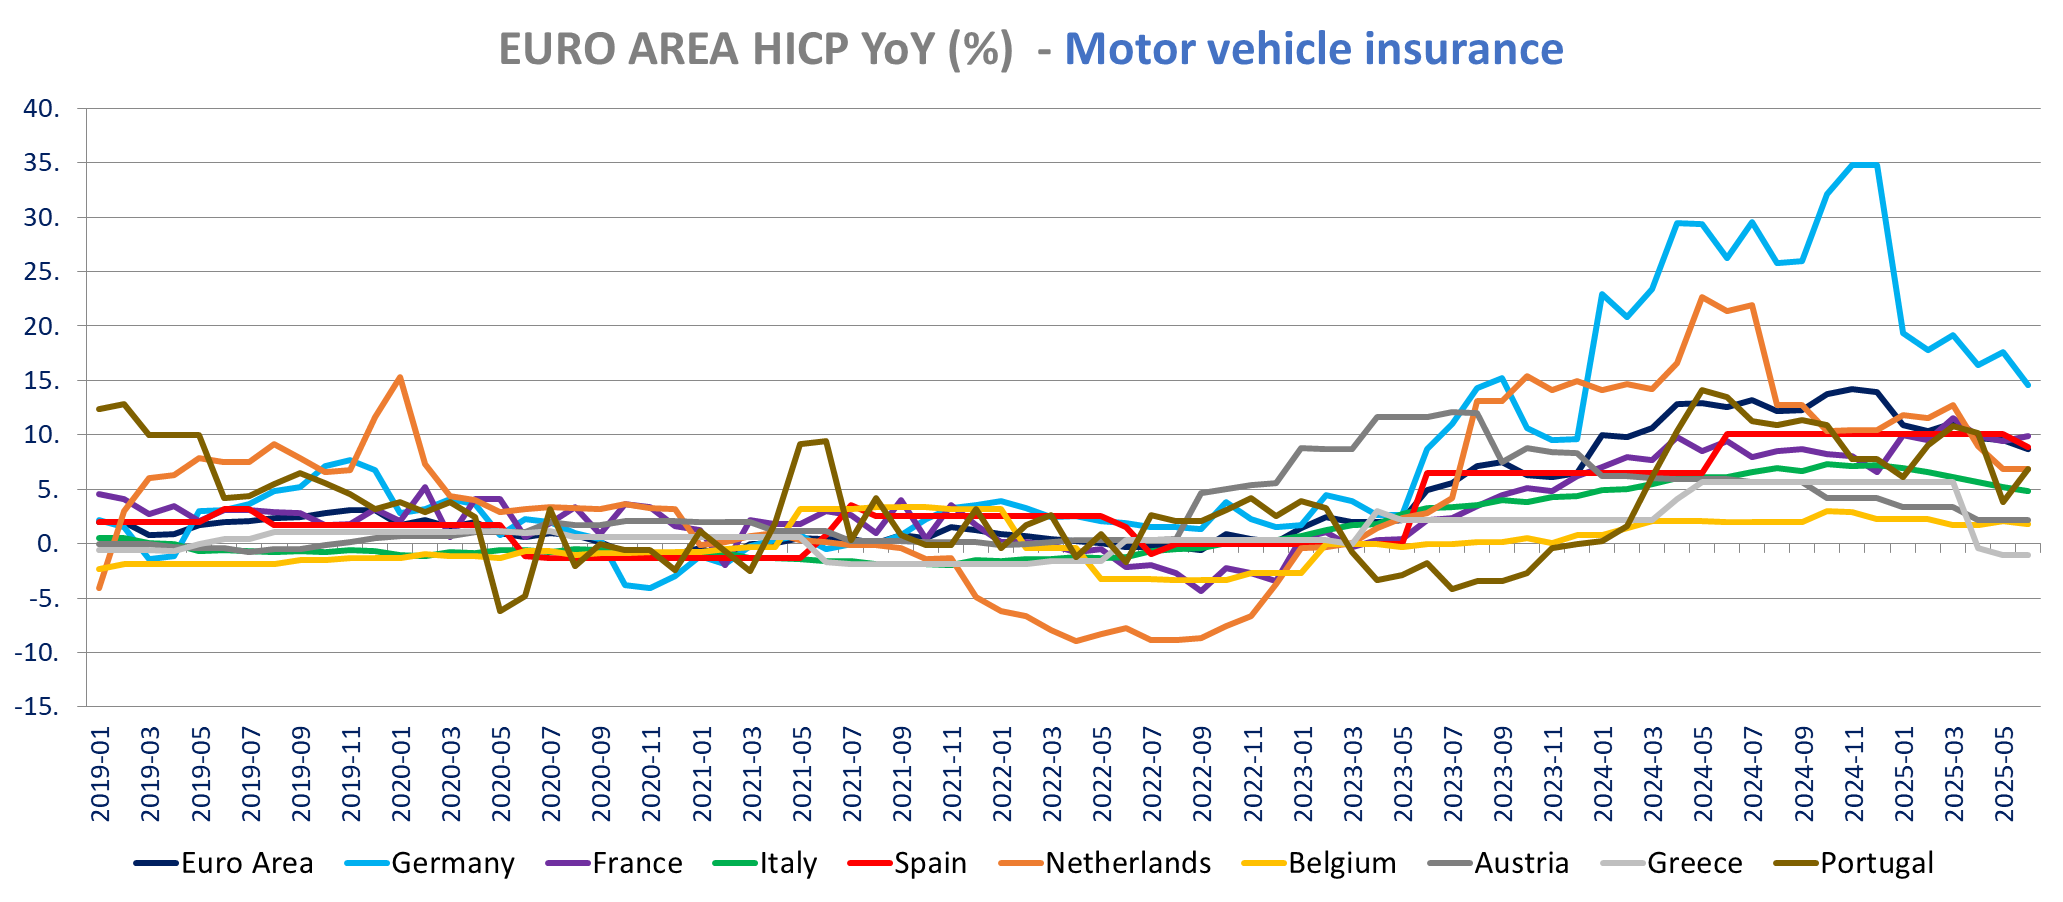
No surprise from the Eurozone final June inflation release. Inflation is confirmed up to 2% up from 1.9% in May with core HICP inflation confirmed unchanged at 2.3% yoy which was the lowest since January 2022. Energy (fuel) and unprocessed food inflation, non-alcoholic beverages inflation were the main causes for the increase in inflation. Services inflation is confirmed slightly up at 3.3% vs 3.2% but with the increase around the more volatile items such air travel, package holiday and accommodation while we see lower insurance, stable rent and restaurants. Non-energy industrial goods inflation is down to 0.5% from 0.6%. That said The HICP Inflation is up in most countries, down only in Germany (2% vs 2.1%), The Netherlands (2.8% vs 2.9%) and Finland (1.9% vs 2%) core HICP inflation declined only in Germany (2.5% vs 2.7%), Austria, Croatia among the larger countries. Food price inflation requires some scrutiny with notable increase in beef prices, fresh fish, eggs. Tobacco inflation was also abnormally down due to the sharp decline in the Netherlands. As for the preliminary release, this is not a game changer for the ECB, with no rate action expected in July, especially as retaliatory tariffs are still a strong possibility.
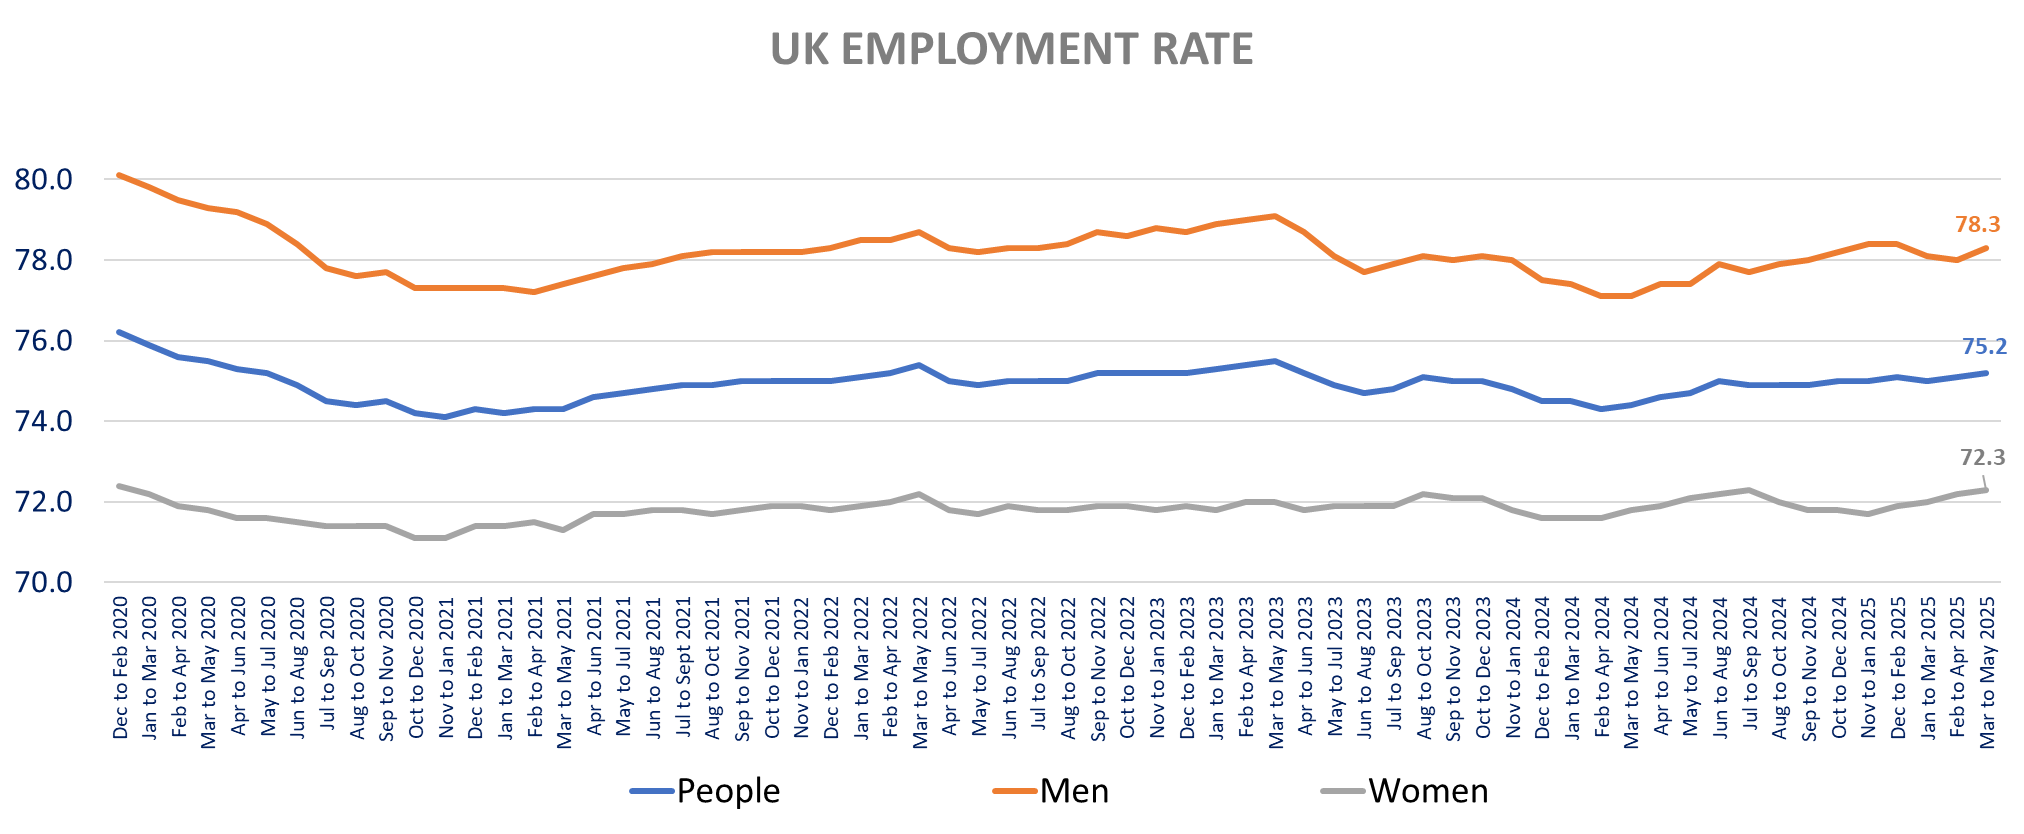
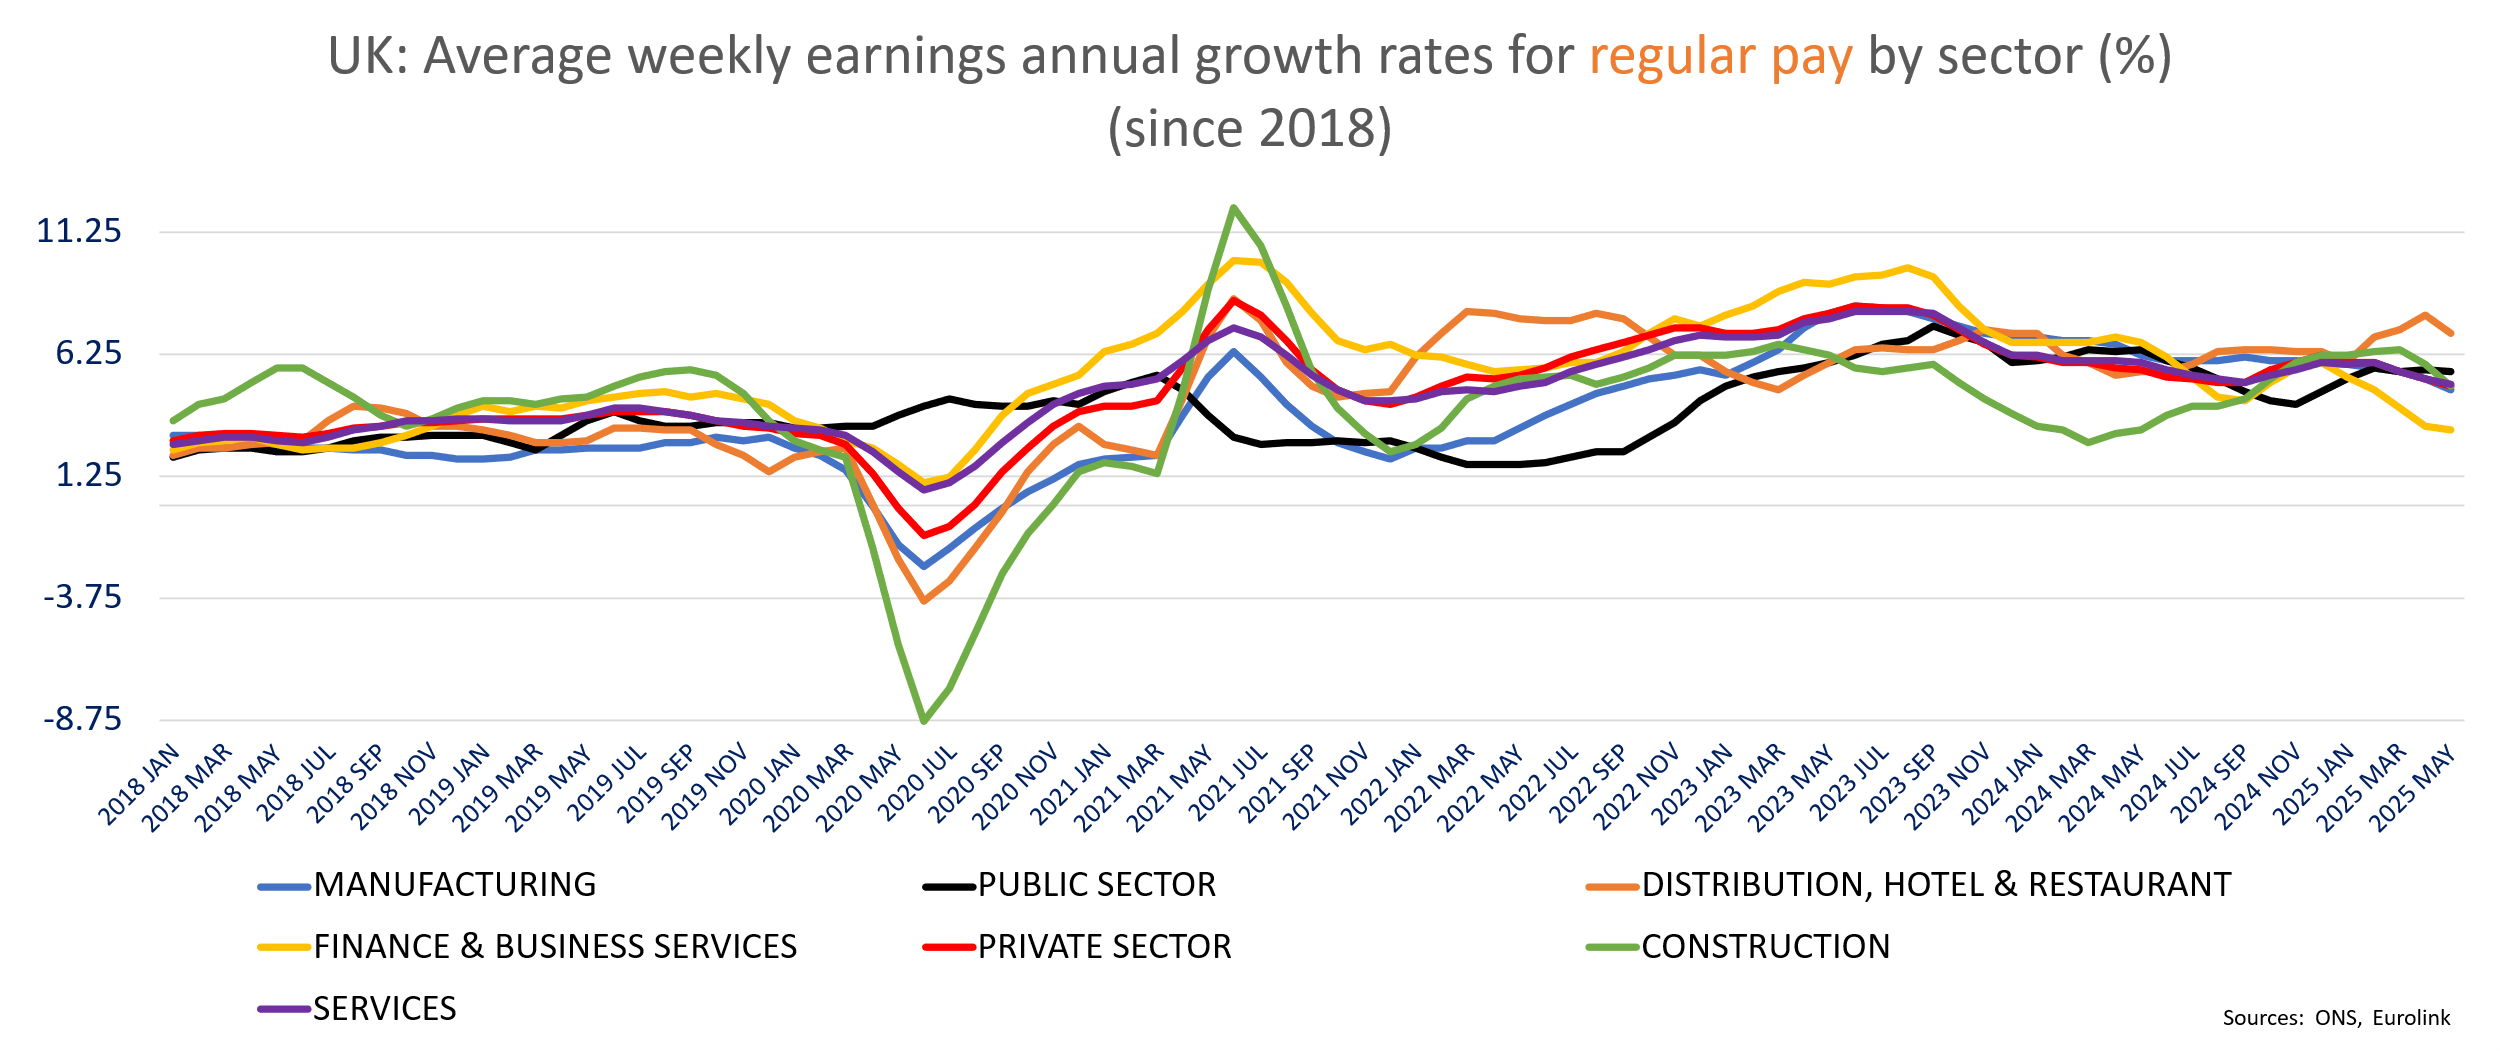
In the UK yields are higher after a higher-than-expected June inflation print yesterday we have a weaker May UK labor market with higher unemployment rate at 4.7% vs 4.6% expected, the highest rate since the 3-months ending July 2021, and lower wage growth especially in construction and financial &business services sectors (with total pay growth is the weakest since September 2020 at 3.4% yoy, down from 3.9% in April. The picture looks less negative on the employment front: The number of employed people jumped by 134k in the three months to May following an +89k in the previous 3 months, beating forecasts of an increase of 46k. The employment rate for those aged 16 to 64 rose by 0.2ppt to 75.2%. The inactivity rate is down -0.4ppt 3m/3m to 21%.
As mentioned yesterday despite the higher CPI, we still see the BoE cutting rates in August. The Job data confirms this view.
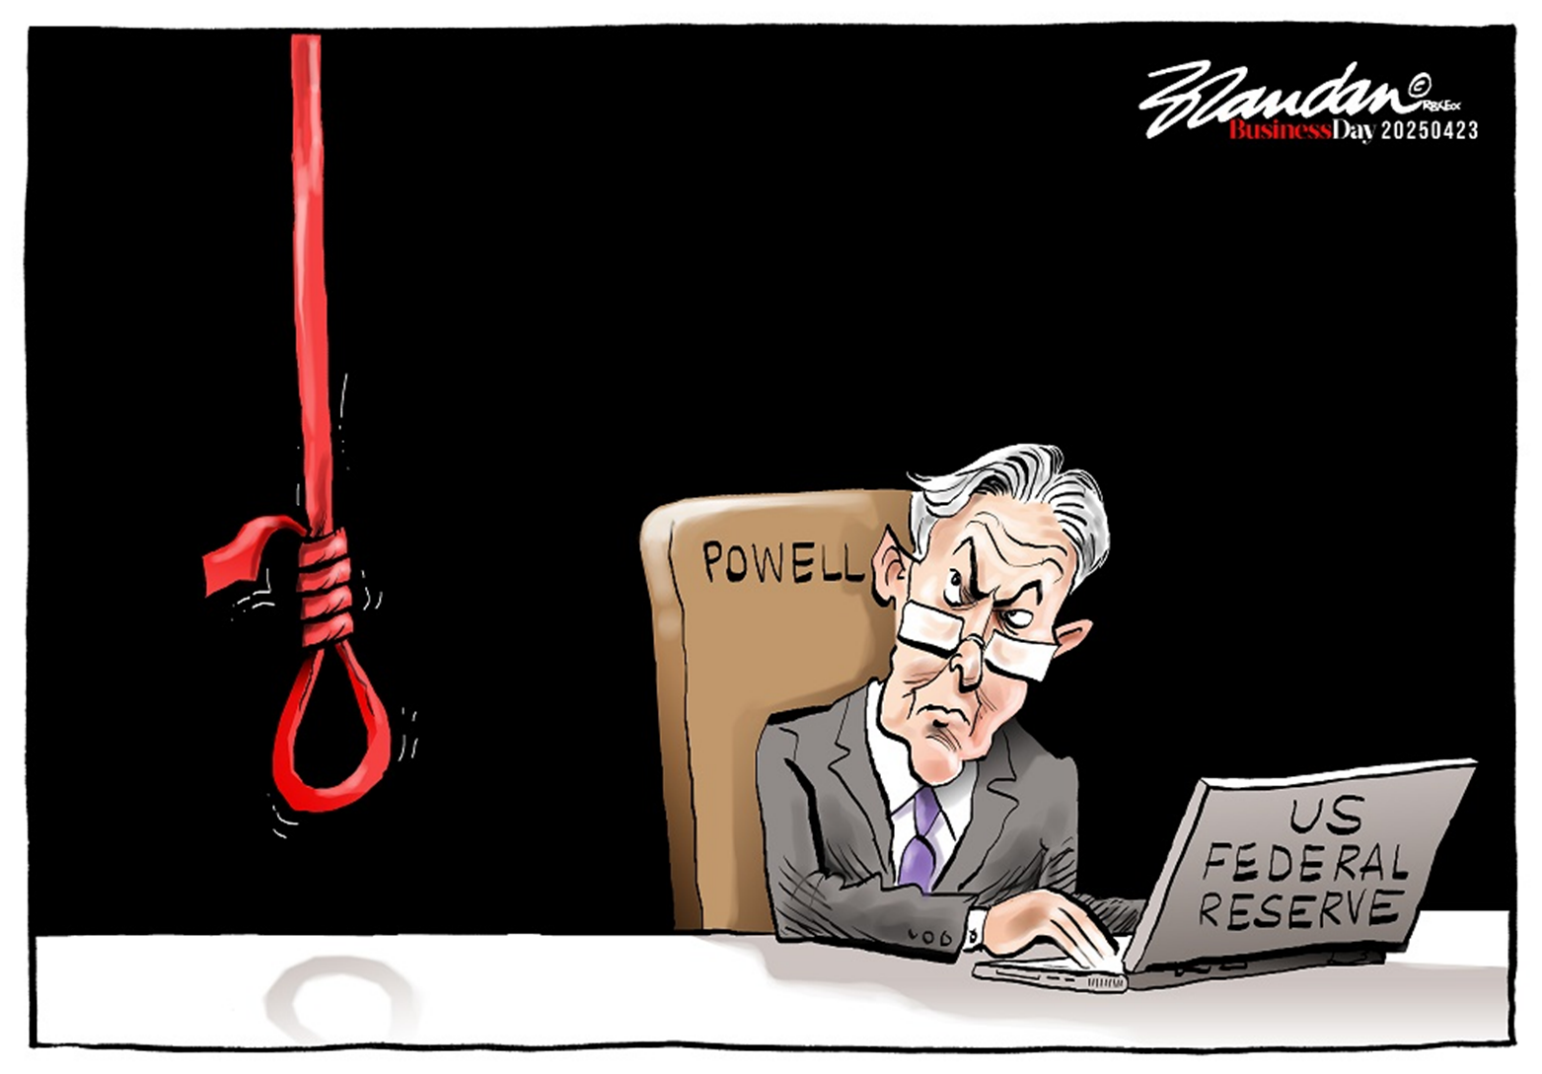
The focus is on tariffs negotiation and the erosion of the Fed independence under constant attack from the US president. Bond yields surged on talks that Powell could be fired, but recovered only half of the increase, when the imminent firing was denied. The independence of the Institution is in balance and will likely be under significant pressure next year. The FOMC composition inertia limits the changes even if the Chairman is replaced by a more politically driven chair. That said the trend is clear and the principle of the Fed independence is more than under question. The replacement will be key with a lesser blow if Waller is chosen, than if Hassett or Warsh are nominated. In any case it will result in steeper curves.
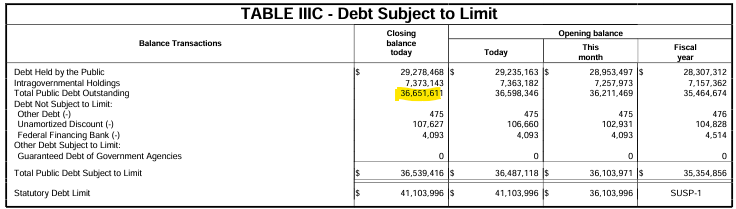
The US treasury strategy to fund in the short end ahead of the Fed cuts is exposing the debt funding to higher inflation, still expected to materialize with higher than anticipated tariffs. The US debt already increased by more than $400bn since the increase of the debt ceiling to $41.1tn earlier this month… In 2023 the debt increased by $2tn in just 4 months after the removal of the debt ceiling.
In Europe Von der Leyen could not force her own “beautiful budget” with commissioner and countries such as Germany opposing the budget. There are no short-term impact but a big setback for the president of the EU commission
On the companies’ front: ABB Ltd reported strong order growth (+14%) in Q2 driven by a large Automation ($600m) order and continued strength in Electrification orders (+9%). In the robotics-related segments, ABB saw delays in investment decisions by customers due to tariff-related uncertainty. Legrand pre-released strong H1 sales largely fueled by continued strong growth in datacenter activity. Organic growth in sales was +9.0% for the period, including +10.1% in the second quarter. This was again mostly driven by North America. Live casino developer Evolution reported second-quarter revenue in line with expectations, while EBITDA profit exceeded forecasts. Volvo Car announced plans to start production of its best-selling XC60 model at its Ridgeville plant in South Carolina, beginning at the end of 2026. Tele2 reported second-quarter revenues in line with expectations, while underlying EBITDA driven by cost controls exceeded forecasts by nearly 6%. The company also announced an upward revision of its full-year guidance. Assa Abloy said organic sales growth was strong for Global Technologies and solid for Americas. Entrance Systems posted slight organic growth, while organic sales declined in EMEIA and Asia Pacific. Wise’s shares down sharply after reporting Q1 cross-border volume that grew +24% YoY (+27% YoY on a constant currency basis) slightly below consensus, to £41.2bn, and Wise customer holdings grew by 31% to £22.9bn. DKSH missed expectations notably in the Consumer Goods segment (which declined 0.5% vs. the expected growth of 0.5%) and the Performance Materials segment (0.8% growth vs. 4% expected). Healthcare performed best but still came in slightly below expectations (3.7% actual vs. 4.0% expected). Publicis beat and raised but CEO comments damped stock performance. CEO Arthur Sadoun warned that H2 could face softer client spending, especially for large transformation projects via Sapient. Essity’s Q2 adjusted EBITA came in 5% below expectations due to lower volumes, particularly in the institutional incontinence market and the U.S. professional hygiene segment. More details on equities here
Constant attack on Powell but clear erosion of the Fed independence ahead
The US public Debt outstanding has already increased by more than $400bn since the lifting of the debt ceiling from $36.1tn to $41.1tn.
The debt increased to $36,651.6bn as of July 15according to the Latest US treasury Daily Report

EUROZONE INFLATION (June Final)
The Eurozone inflation (HICP) is confirmed at 2% in June (0.3% m/m), up from 1.9% in May, with just minor revisions for energy, revised up to -2.6% yoy from -2.7% yoy initially (0.2% m/m vs 0.1%), up from -3.6% yoy in May, and processed food (including alcohol & tobacco), revised down to 2.6% from 2.7%, up 0.1% m/m vs 0.2%m/m initially, easing from 2.9% yoy in May.
The core inflation is confirmed to be unchanged at 2.3% yoy (0.4% m/m) and services inflation confirmed at 3.3% yoy up from 3.2%yoy in May, up 0.7% m/m. Non-energy industrial goods inflation is down to 0.5% from 0.6% as reported with preliminary estimates.
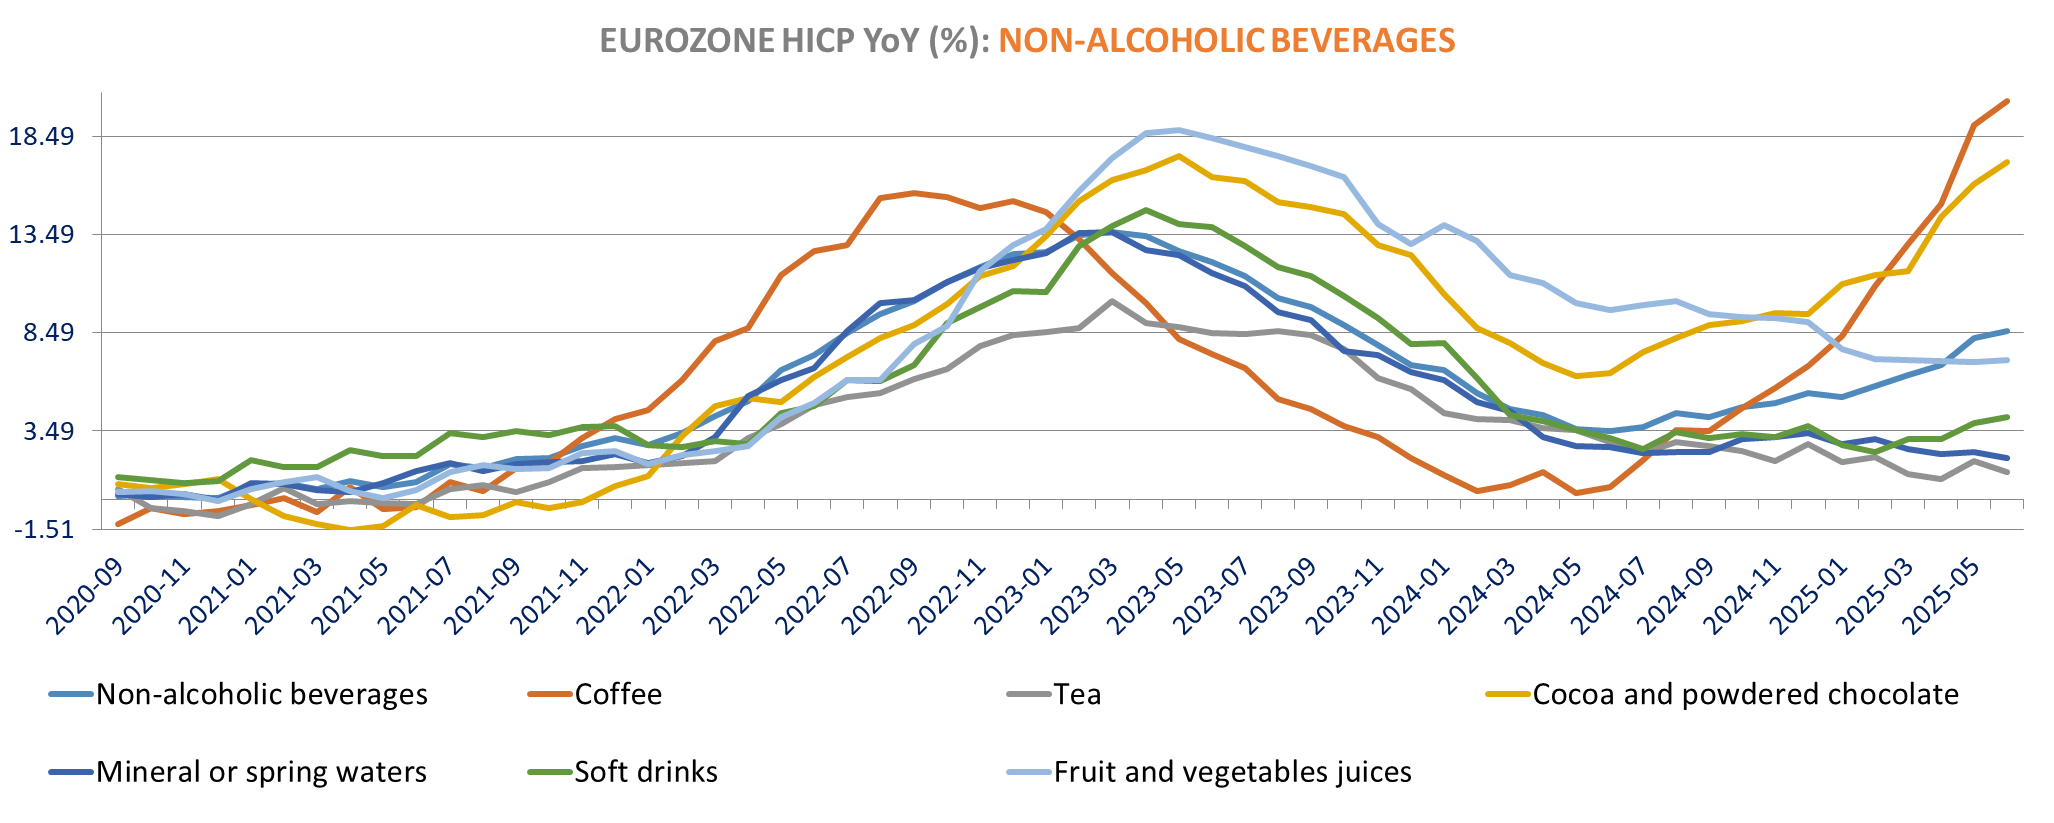
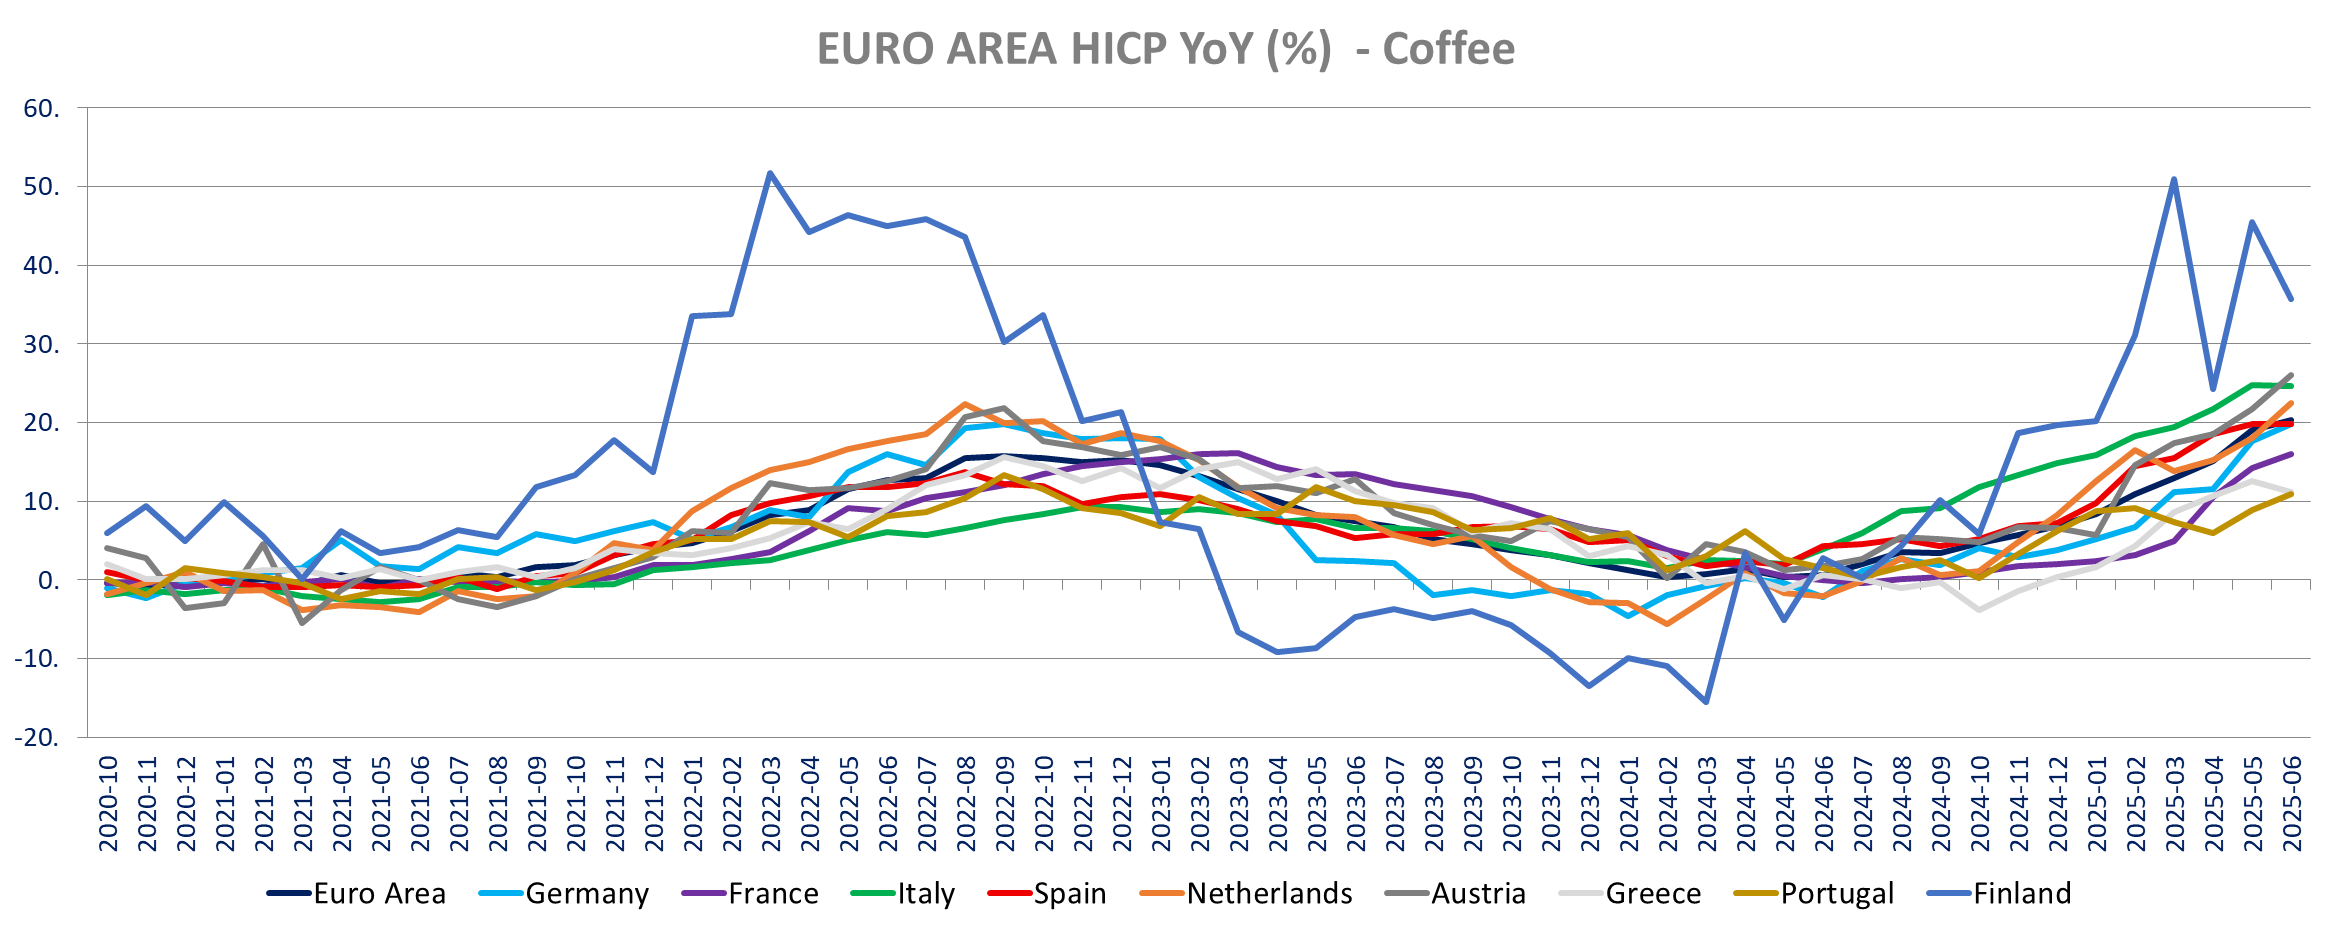
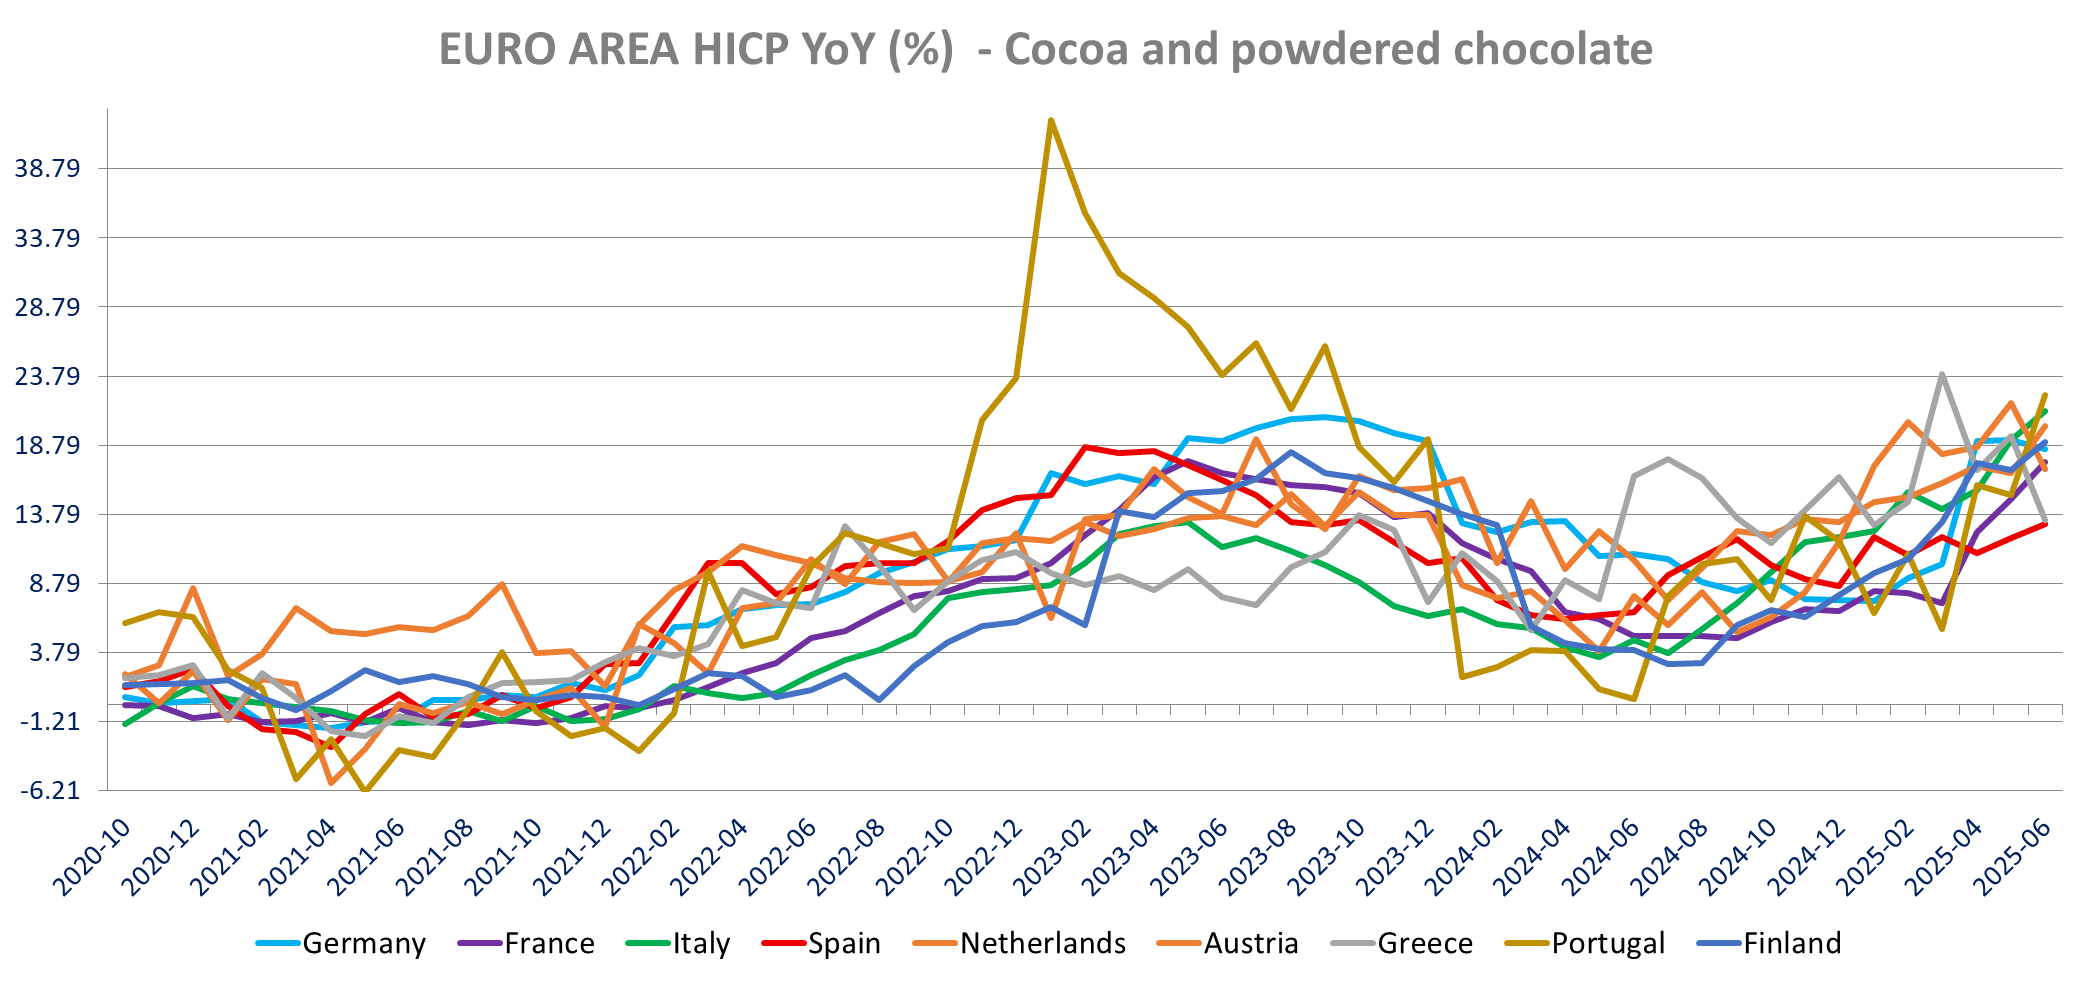
Food inflation (including tobacco & alcohol) is confirmed at 3.1% yoy (down from 3.2%), unprocessed food confirmed t +4.6% yoy (up from 4.3% yoy in May) and processed food inflation (including tobacco & alcohol) is down to 2.7% from 2.9% in May as mentioned above. Non- alcoholic beverages inflation increased to 8.6% yoy from 8.2% in May (0.6% m/m) as we saw in most countries’ CPI releases (up in Germany, France, Italy, the Netherlands, Portugal) with Higher coffee prices inflation (20.3% vs 19.1%) and cocoa-based drinks inflation (17.2% vs 16.05%)
The HICP Inflation is up in most countries, down only in Germany (2% vs 2.1%), The Netherlands (2.8% vs 2.9%) and Finland (1.9% vs 2%). It increased the most in Spain (2.3% vs 2%), France (0.9% vs 0.6%), Portugal (2.1% vs 1.7%) an Estonia (5.25% vs 4.6%).
Core inflation increased in France, Italy, The Netherlands, Belgium, Greece, Portugal, Latvia and Estonia, but was unchanged in Spain, Finland, Ireland, Lithuania, Slovakia and Slovenia. Core HICP inflation declined only in Germany (2.5% vs 2.7%), Austria, Croatia among the larger countries.


HICP

Core HICP

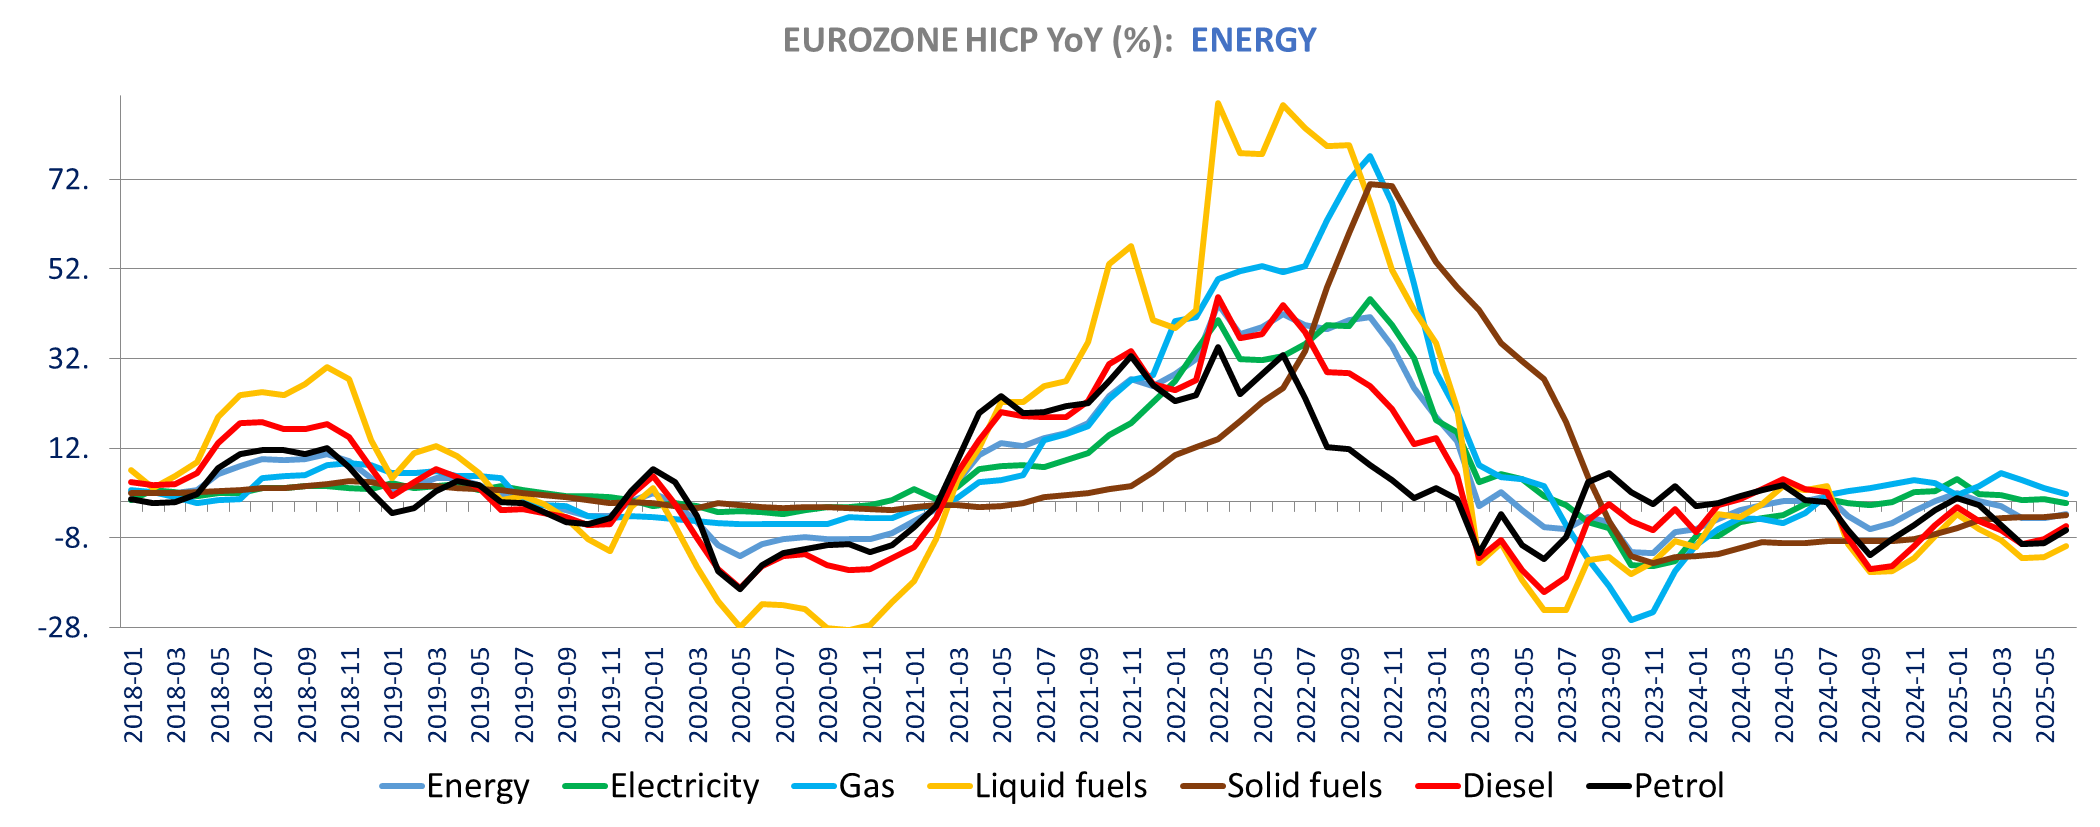
Energy
At the eurozone level the increase in energy inflation (-2.6% yoy vs -3.6% yoy in May) is driven by higher liquid fuel inflation (-9.7% vs -12.2% yoy) with diesel at -5.3% yoy vs -8.3% and gasoline at -6.2% vs -9.9%). Electricity (-0.3%yoy vs +0.6% yoy in May) and gas inflation (+1.9%vs +3.2%) eased in June. Administered energy prices declined -4.7% yoy down from -4% yoy in May. Solid fuel inflation is up to -3%yoy from -3.3% yoy.
Energy inflation increased in most countries in June, down only in Italy, Belgium , Portugal, Finland and Estonia.

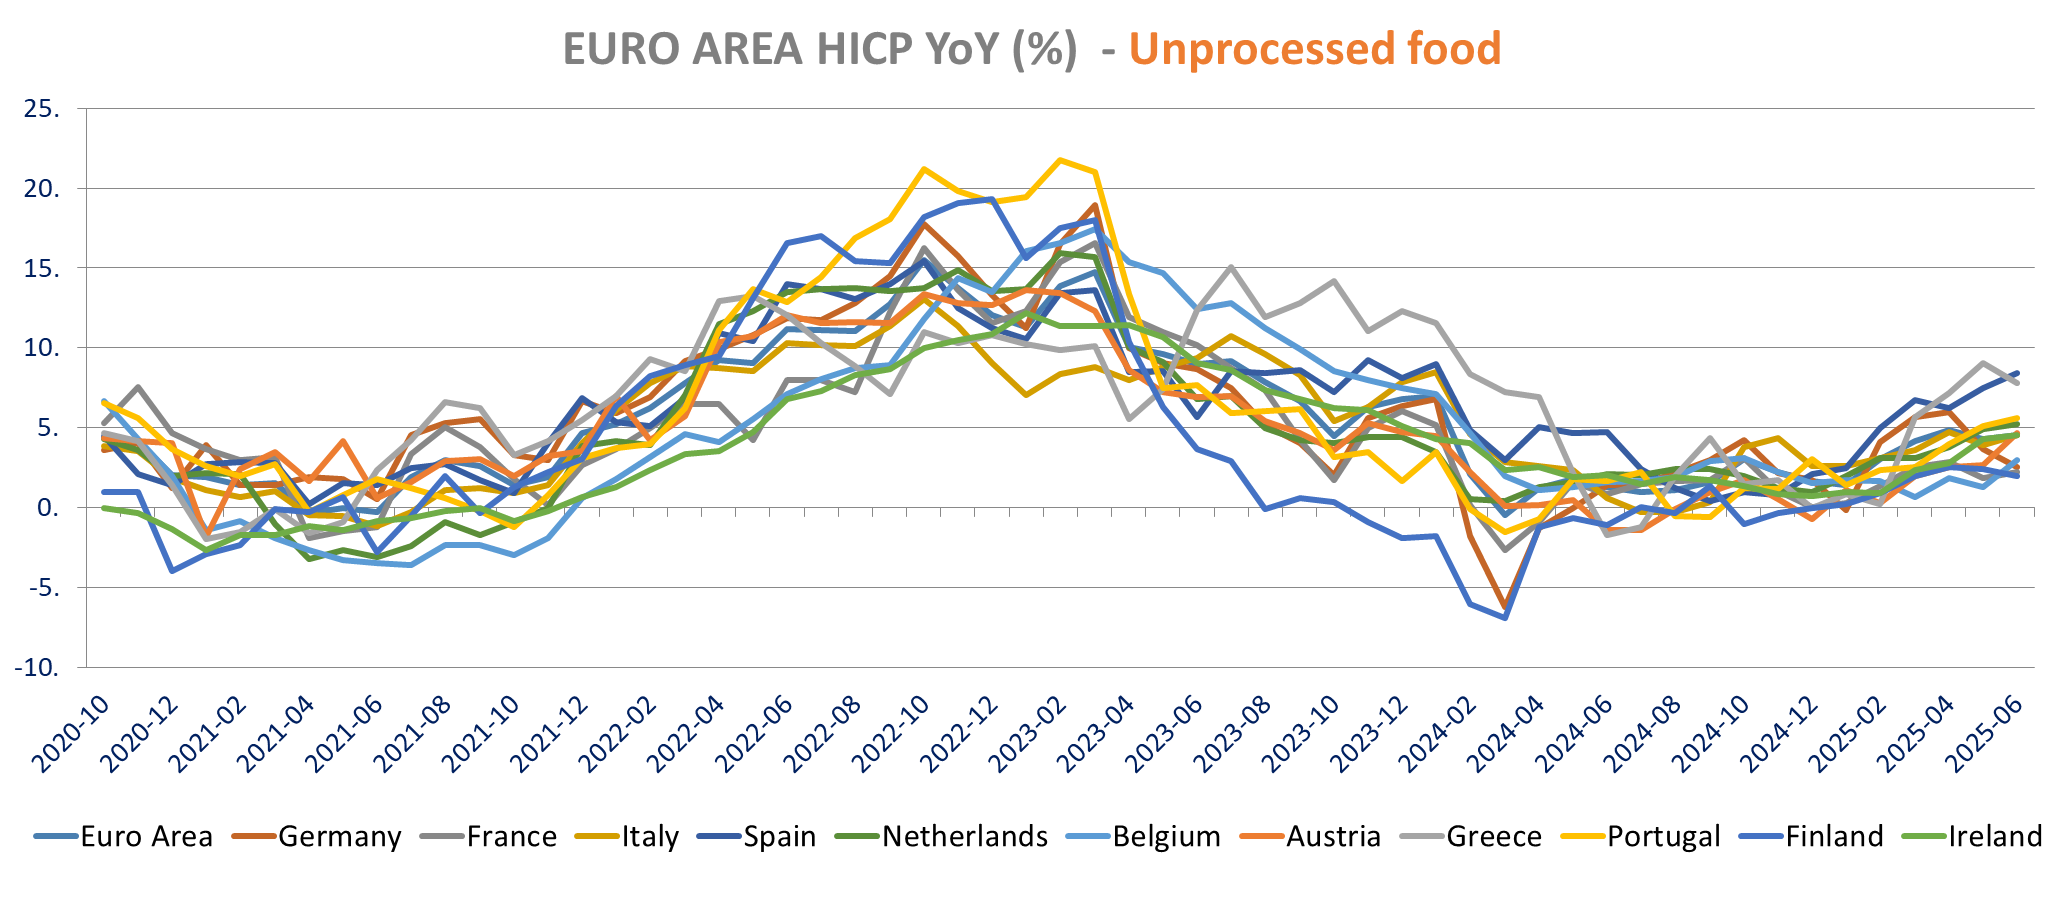
Food inflation is down to 2.3% from 2.4%, but we see higher unprocessed food price inflation to 4.6% from 4.3% (up in most countries) with prices down -0.15% m/m (-0.4% m/m in 2024). Fresh Vegetable inflation is down to -0.9% from +0.35% (-3.3% m/m) but fresh fruit inflation is higher at 7.5% from 6.8%. Inflation increased for meat (3.7% vs 3.3%), fresh Fish (2.8% vs 2.1%), eggs (6.2% vs 5.7%) and cheese (3.6% vs 3.5%). Inflation is down for milk (5.5% vs 5.6%) and oil & fats (9.1% vs -8.2%). As noted with the domestic CPI data, Beef & Veal price inflation surged to 9.8% vs 8.8% (Highest since March 2023) increasing in all countries but Germany (9.5% vs 9.6%) and Croatia (21.8% yoy vs 23.4% yoy) with double digit increase in all countries but France (4.9% yoy vs 3.9% yoy in May) and Italy (5.9% yoy vs 5.4% in May).

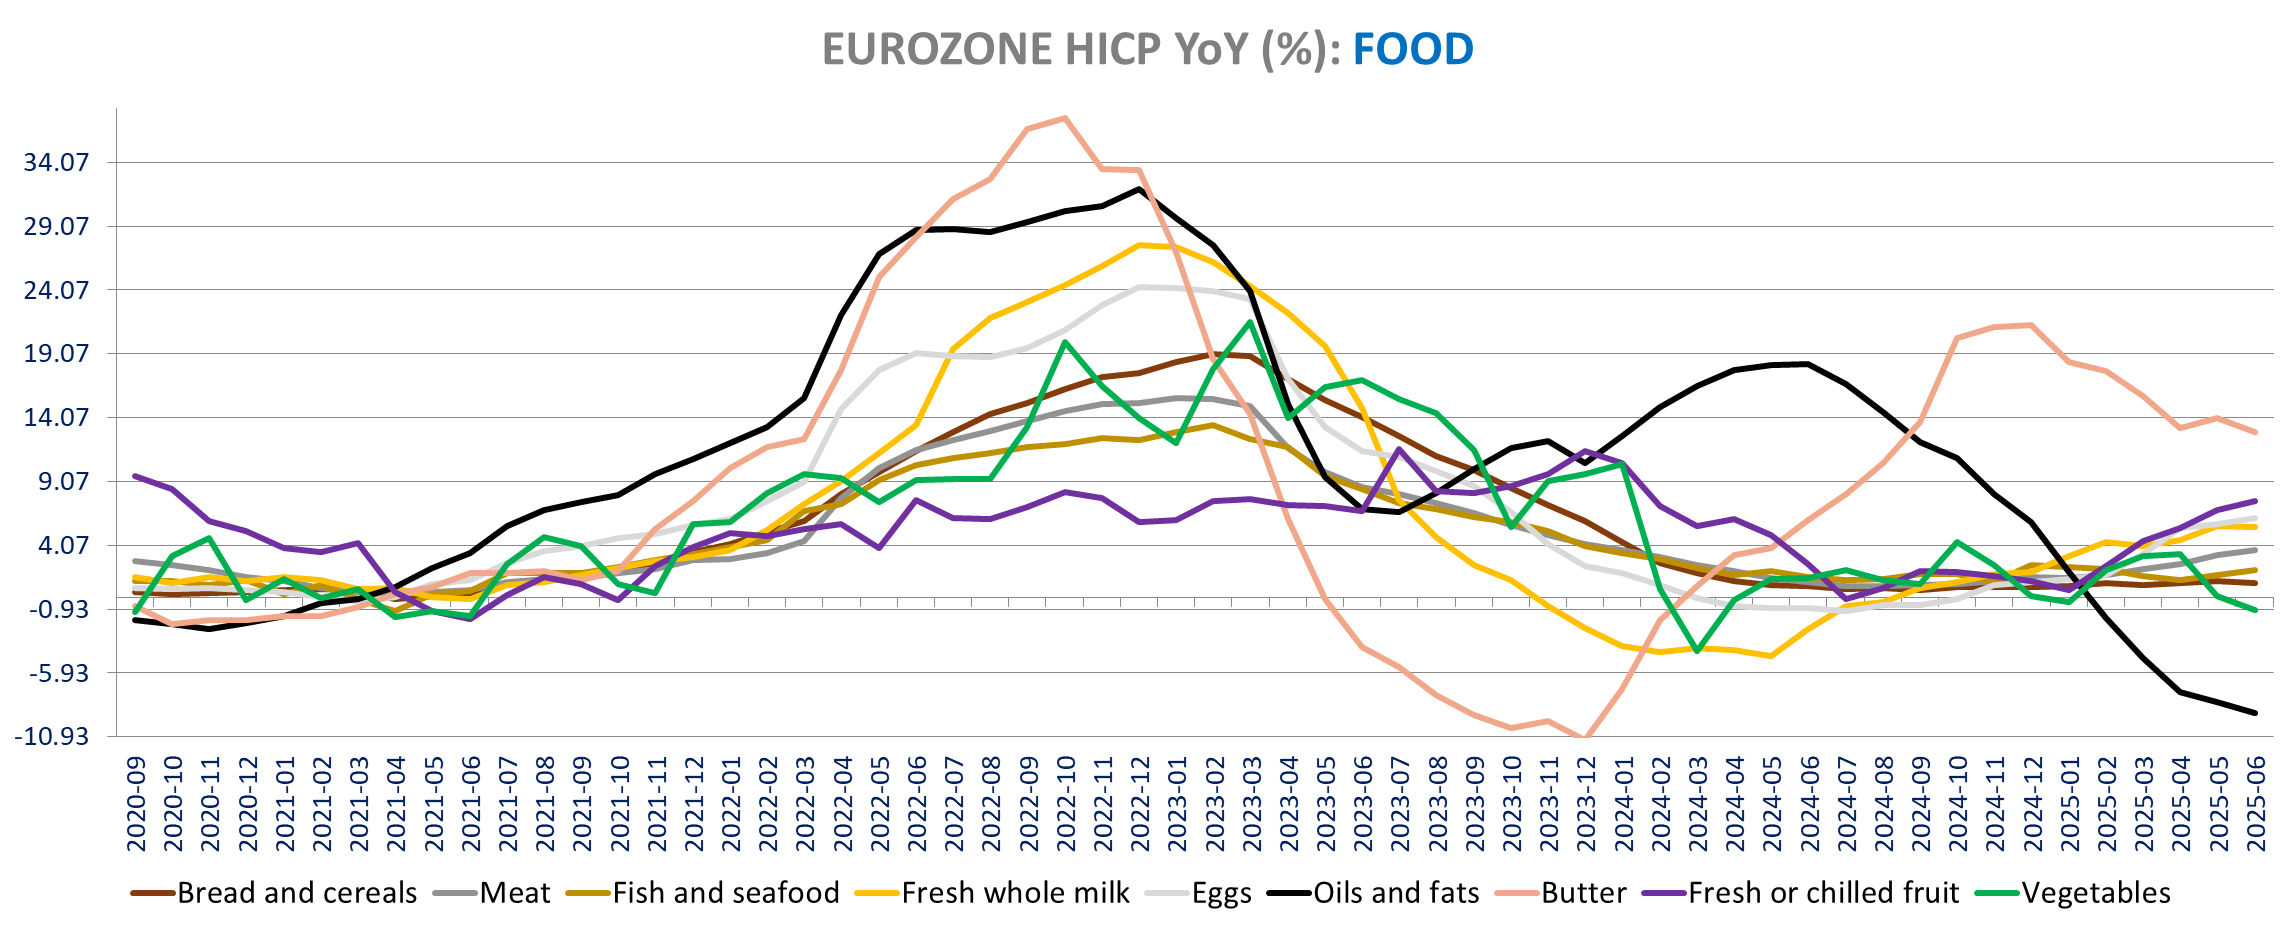


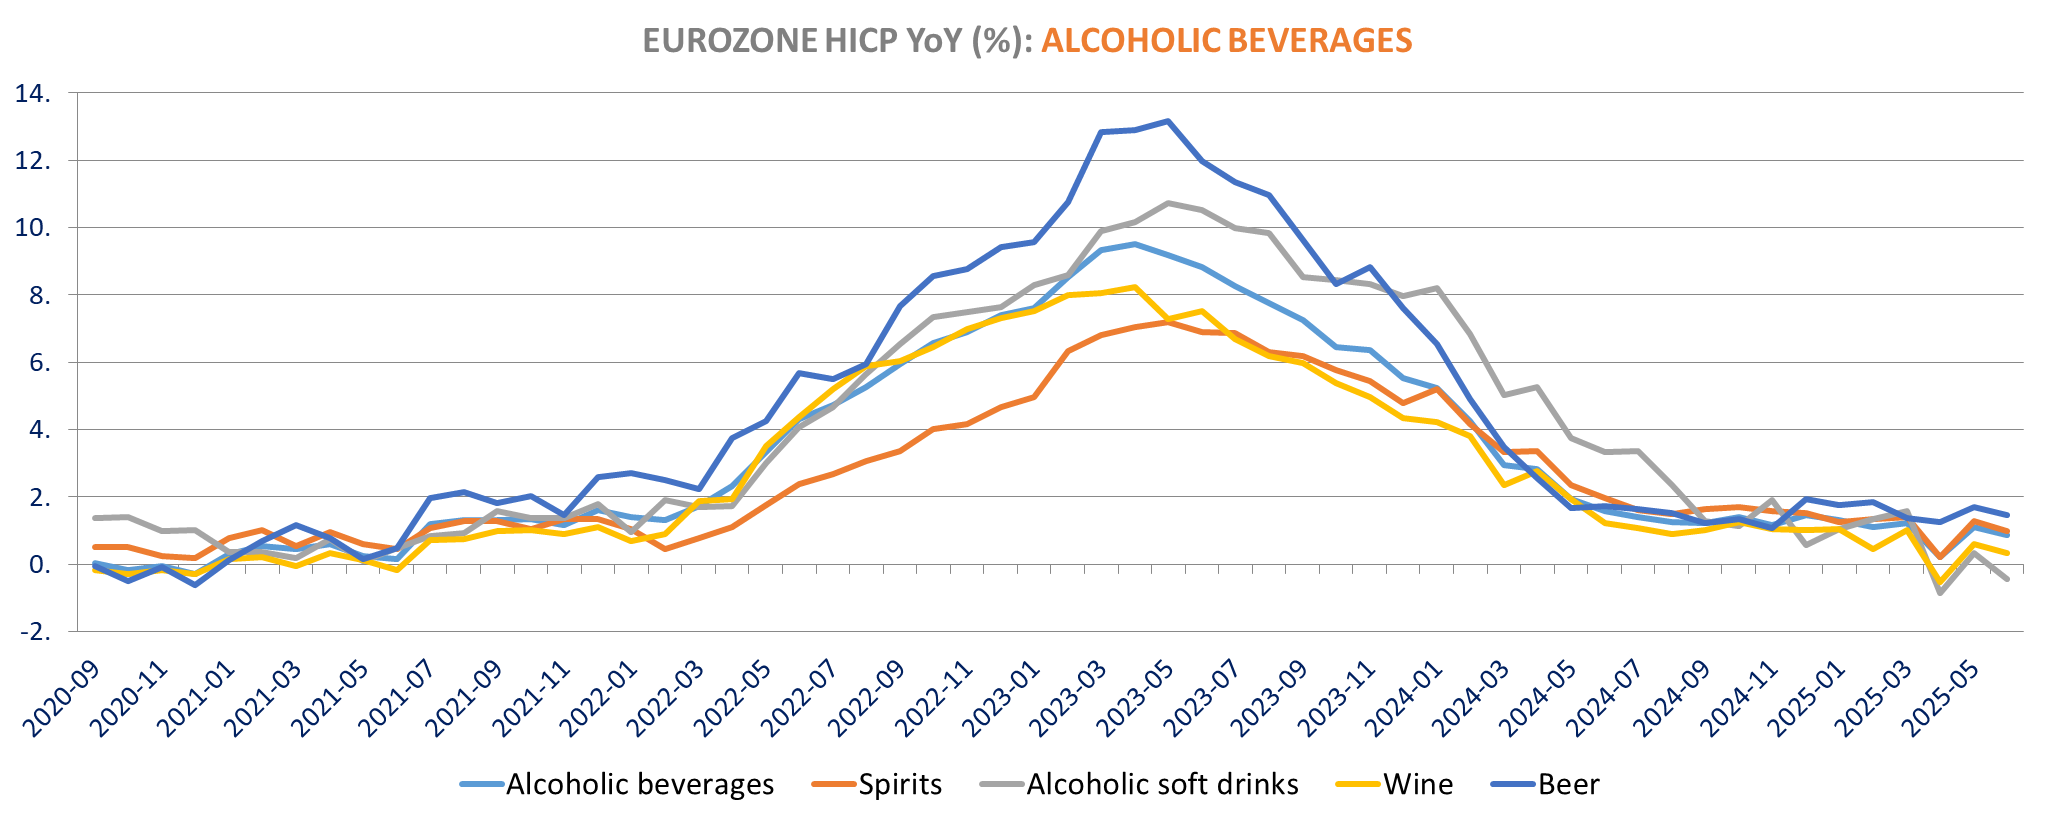
Alcoholic beverages inflation is slightly lower at 0.9% yoy from 1.1%, but we see another increase in non-alcoholic beverages inflation to 8.6% vs 8.2% on higher coffee prices (20.3% vs 19.1%) and cocoa based drinks (17.2% vs 16.05%), but also soft drinks (4.2% vs 3.9%) and Juice (7.1% vs 7%). Mineral waters and teas inflation is down.
We also note tobacco inflation is down to 5.9% from 6.9% mainly due to a sharp decline in the Netherlands (past anniversary of main passthrough of 2024 excise duty) where tobacco inflation declined to 8.6% yoy in June from 31.2% in May.

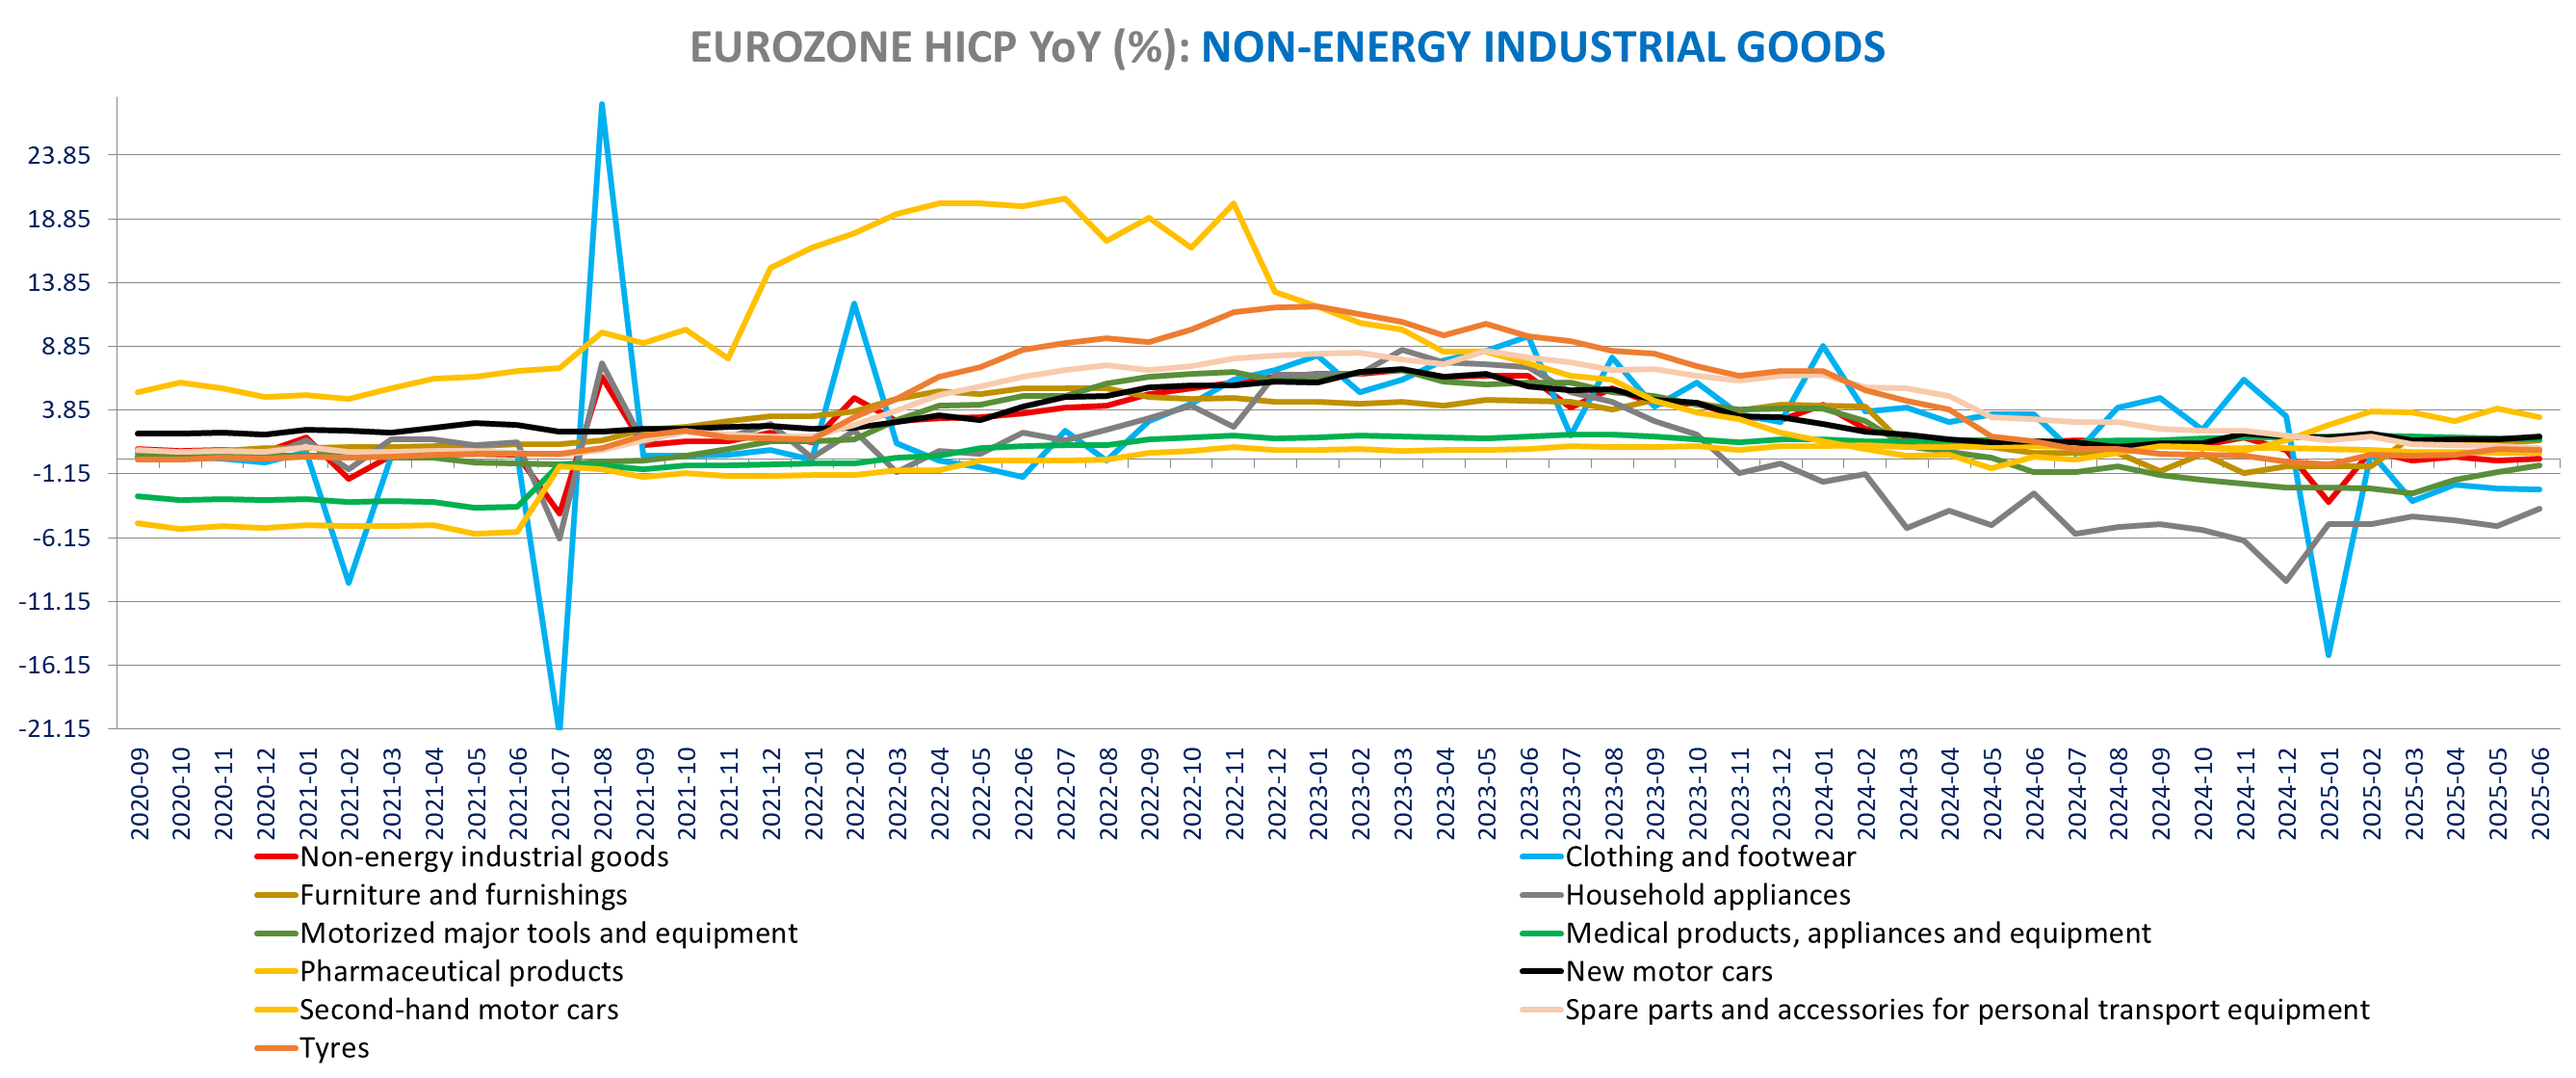
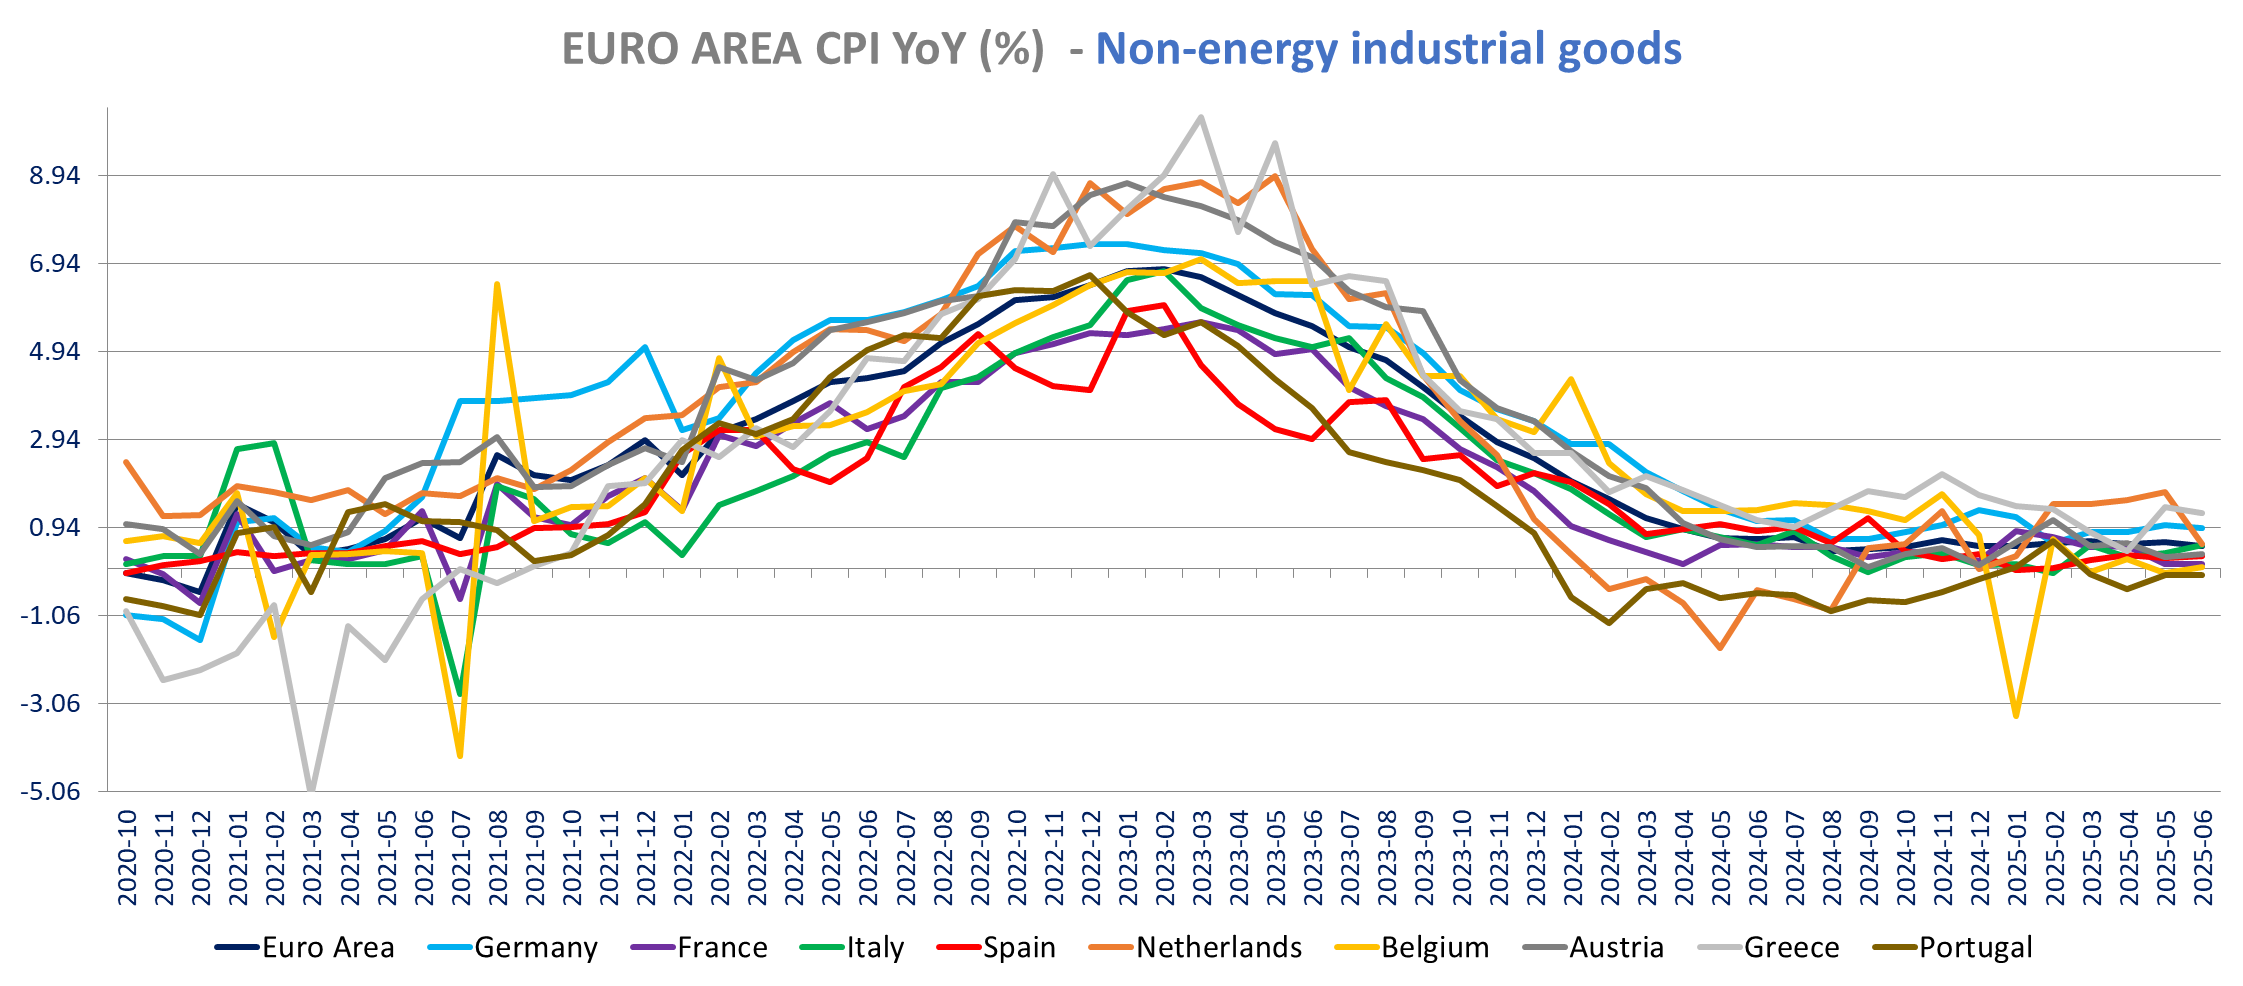
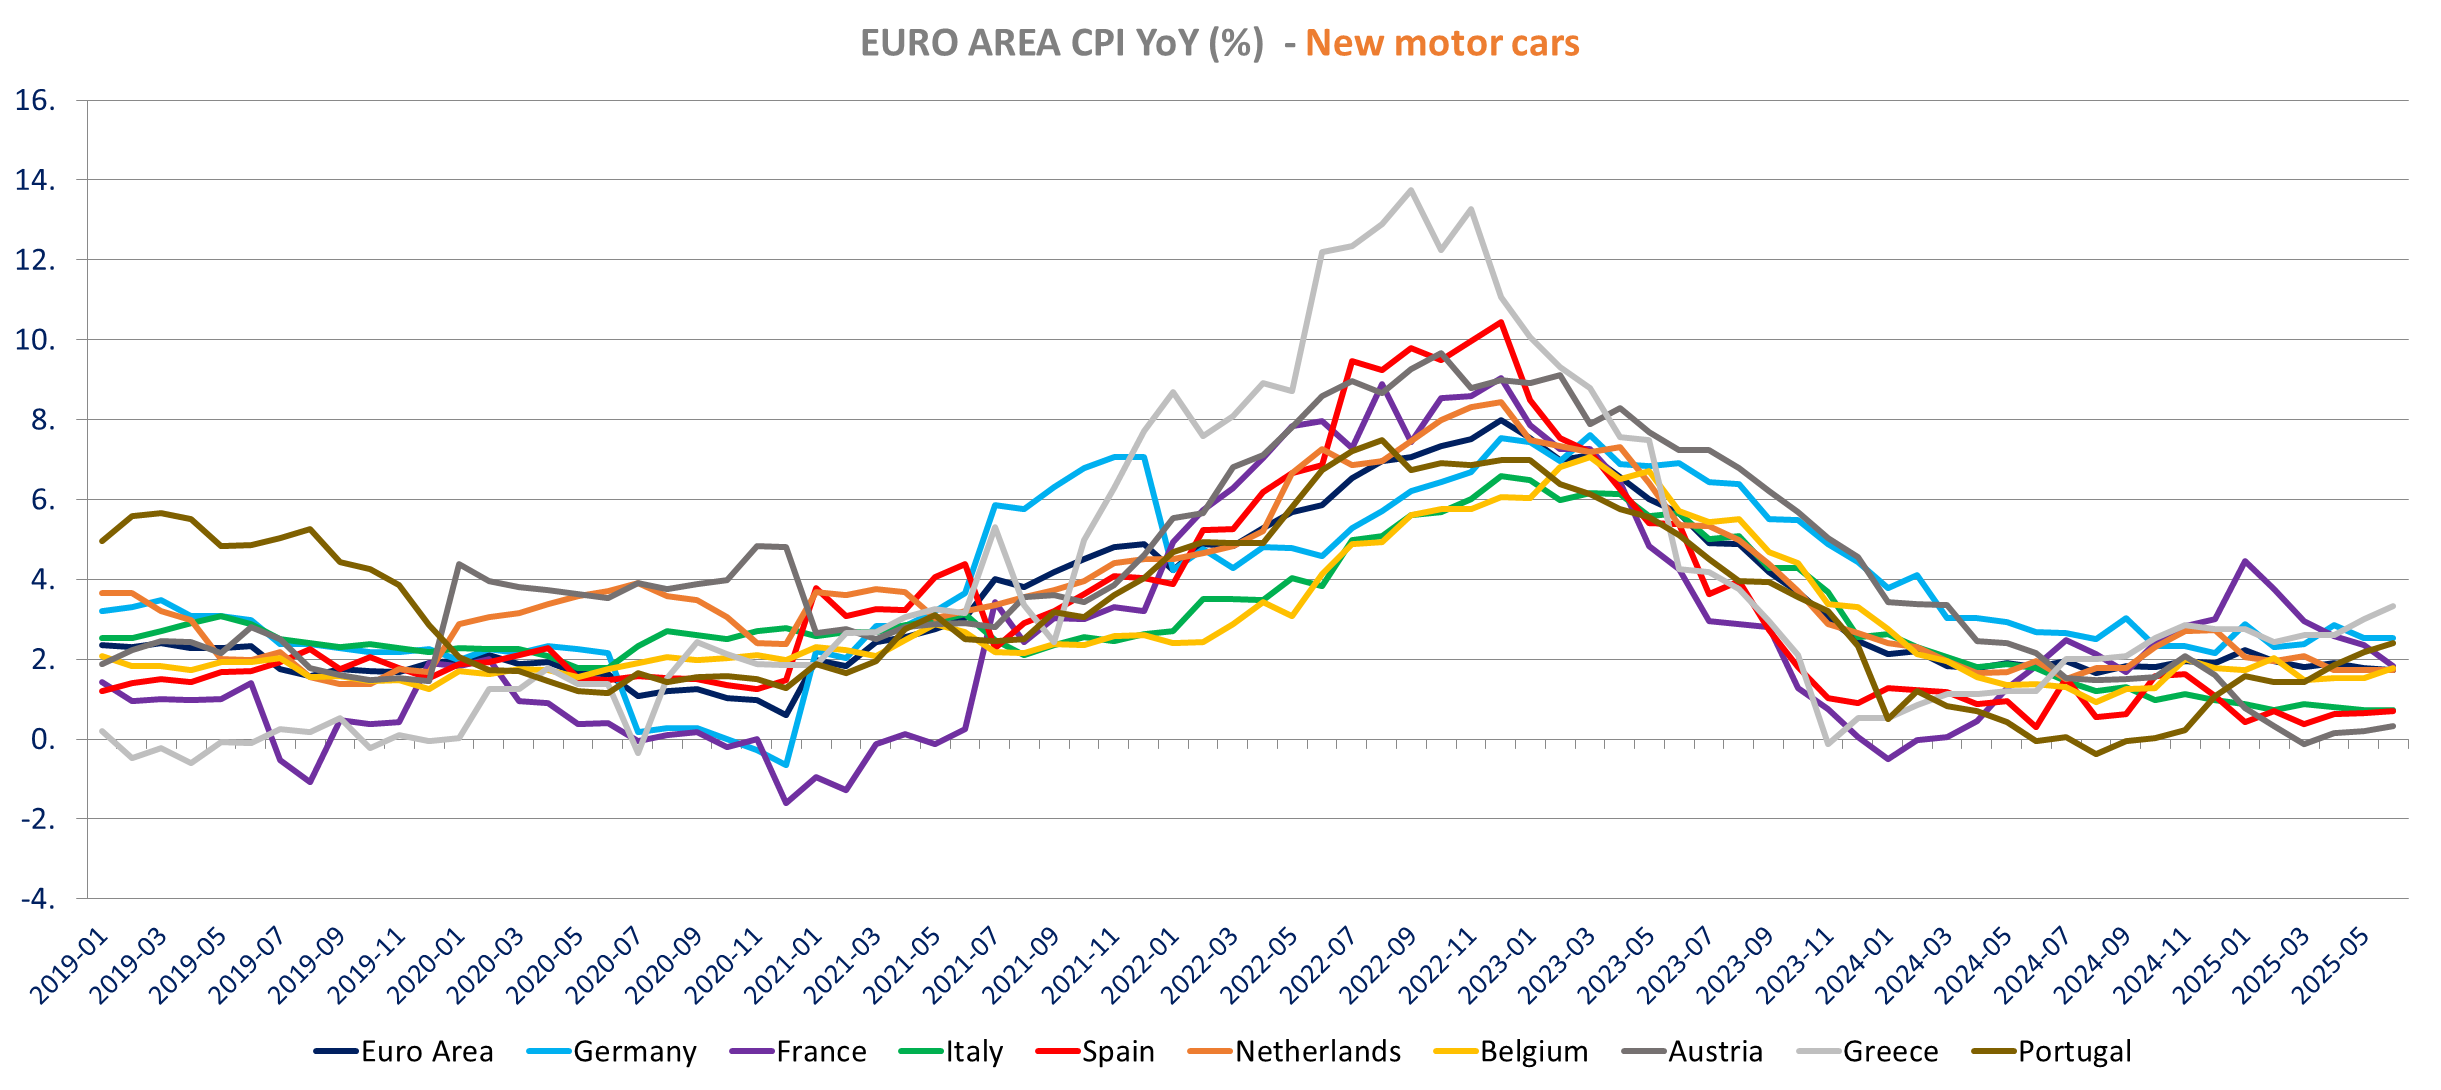
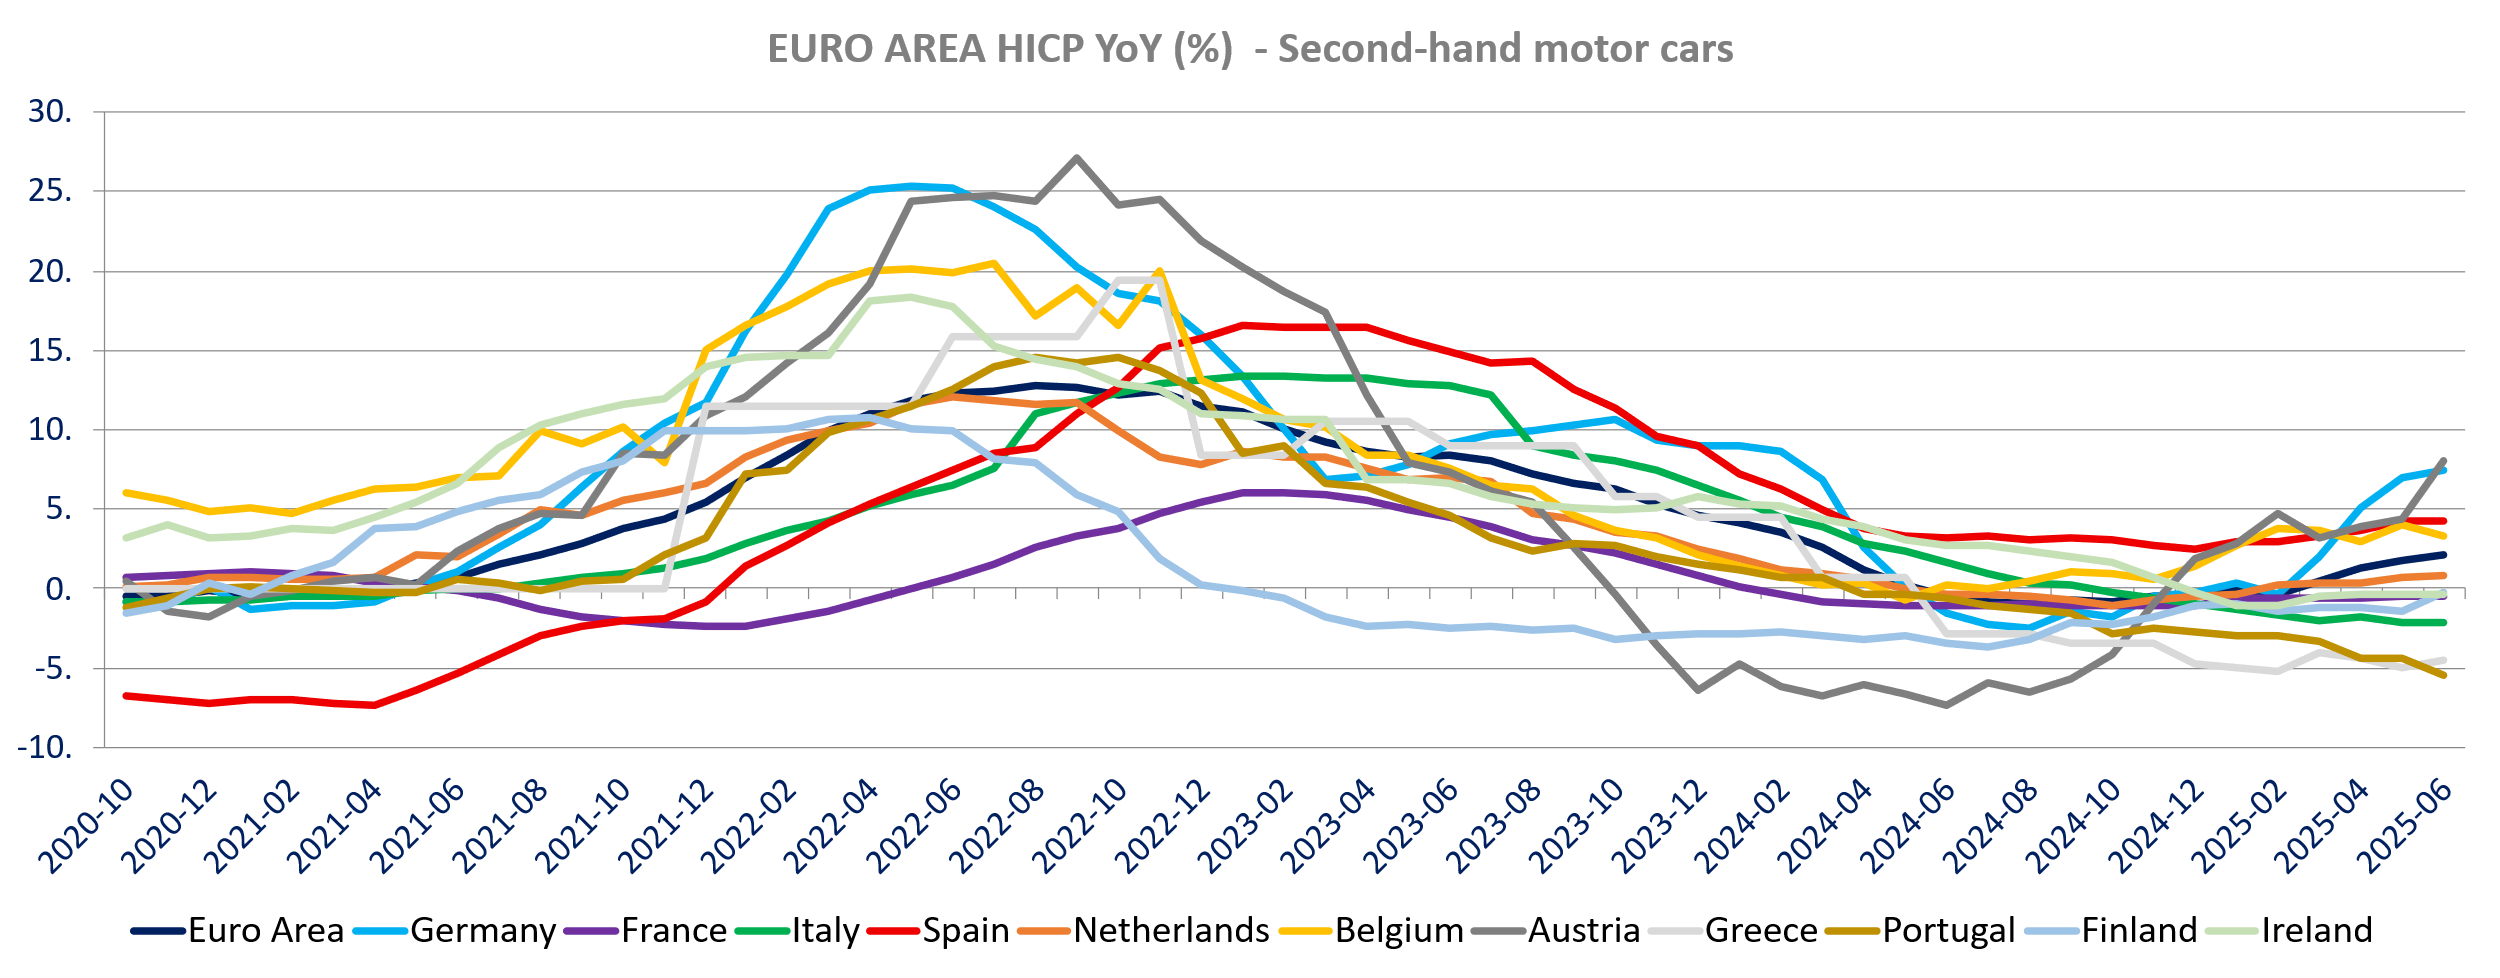
Non-energy industrial goods inflation is down to 0.5% from 0.6%, up for durable goods (0.2% vs 0.1%), down for semi-durable goods (0% vs 0.4%) for non-durable (1.6% vs 1.7%). Inflation increased of clothing, footwear, furniture, appliances, but down for household textiles, medical products and new cars (1.7% vs 1.8% yoy). Inflation increased for used cars at 2.1% yoy from 1.8% with increase in Germany and Austria.

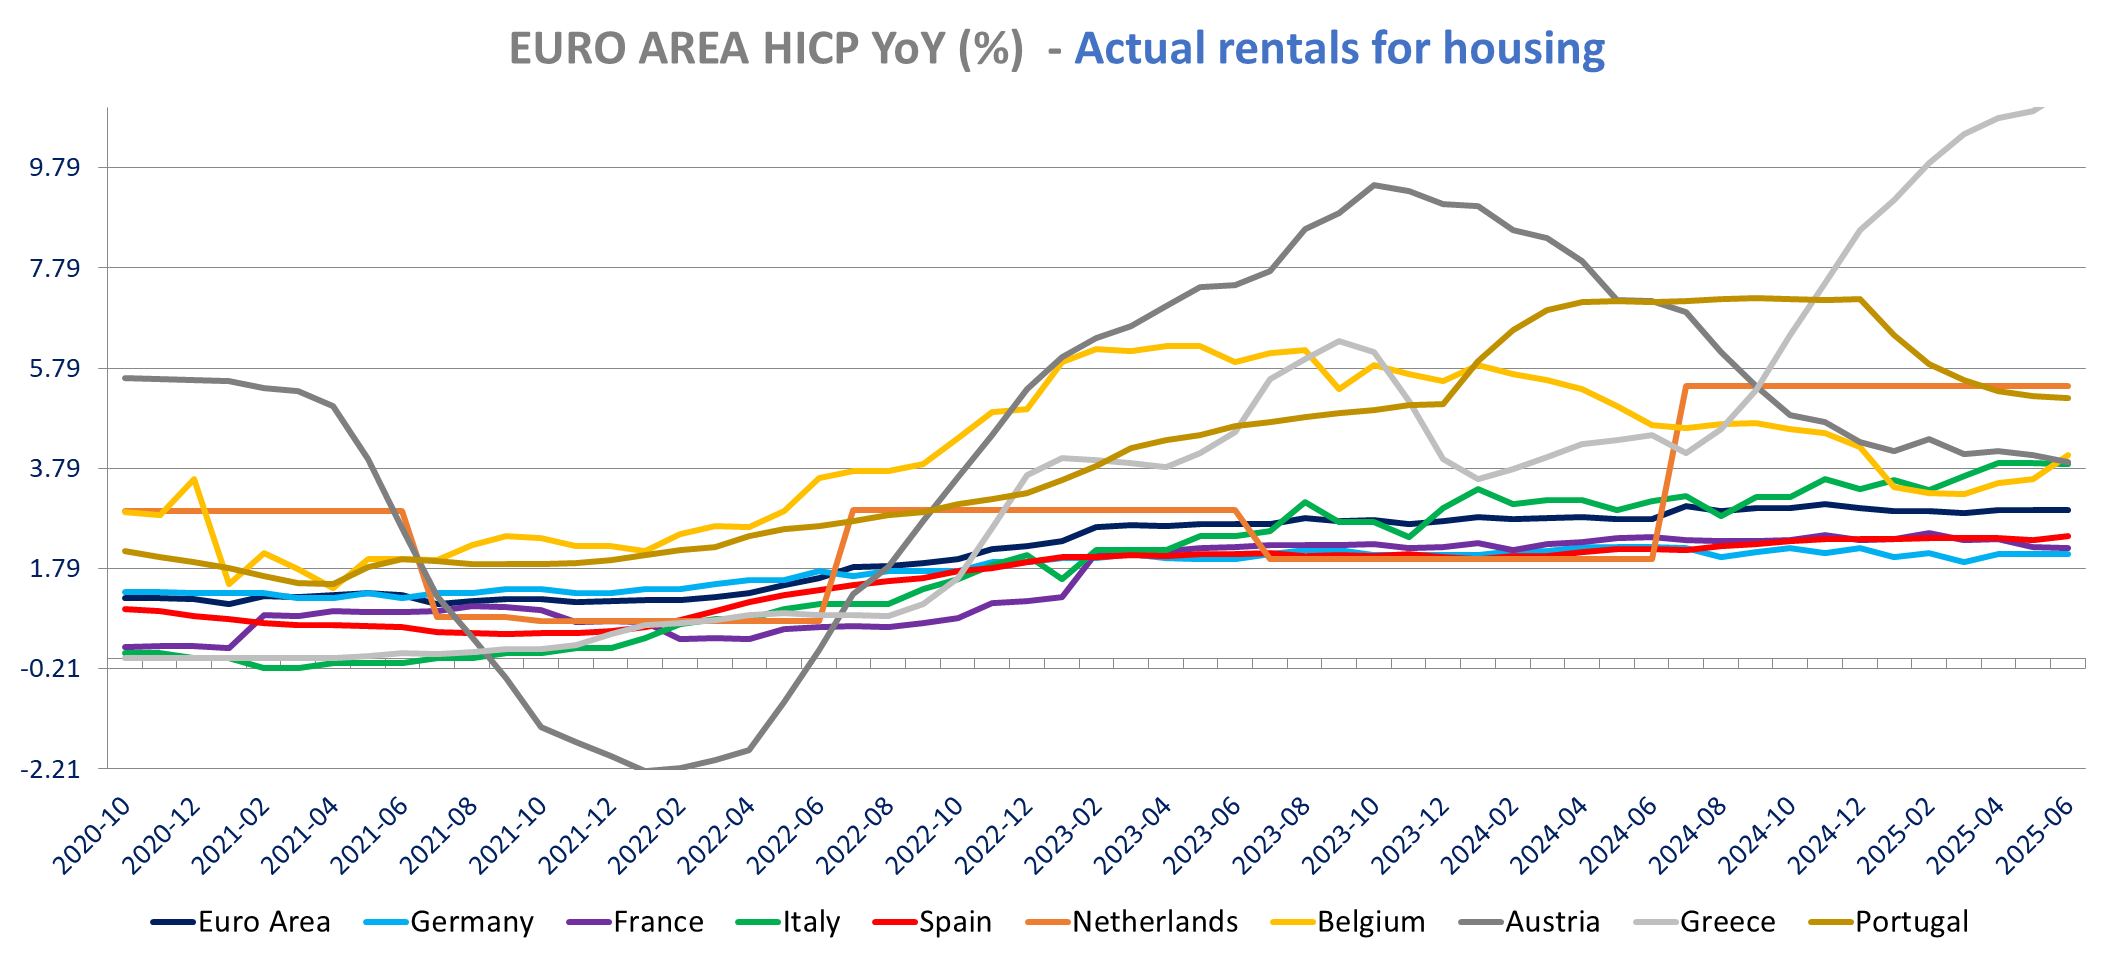
Services Inflation increased slightly to 3.3% from 3.2% up 0.7% m/m. Services inflation increased in France, Italy, The Netherlands (3.85% vs 2.8%), Belgium, Greece, Portugal, Estonia (11.7% vs 9.9%) and Slovakia. It fell significantly for Germany (3.5% vs 3.8%) and decline slightly for Spain, Austria, Finland, Latvia, Lithuania, Slovenia.
Inflation increased for air transport, package holiday, accommodation, recreational services and hospital services. Inflation declined for social protection (5.5% vs 5.7%), auto insurance (8.65% vs 9.5%), and was stable for restaurant (3.9%), cultural services (3.3%), education (3.9%) and rent (2.95%)…


The UK Labor market continued to cool in May, with the unemployment rate up to 4.7% from 4.6%, above expectations of 4.6% and the highest rate since the 3-months ending July 2021. Wage growth slowed down (see details below) but on the other hand, employment increased more than expected. The number of employed people jumped by 134k in the three months to May following an +89k in the previous 3 months, beating forecasts of an increase of 46k. The employment rate for those aged 16 to 64 rose by 0.2ppt to 75.2%. The inactivity rate is down -0.4ppt 3m/3m to 21%. The estimated number of vacancies in the UK fell by 56k on the quarter, to 727k in April to June 2025. ONS Release
Wages
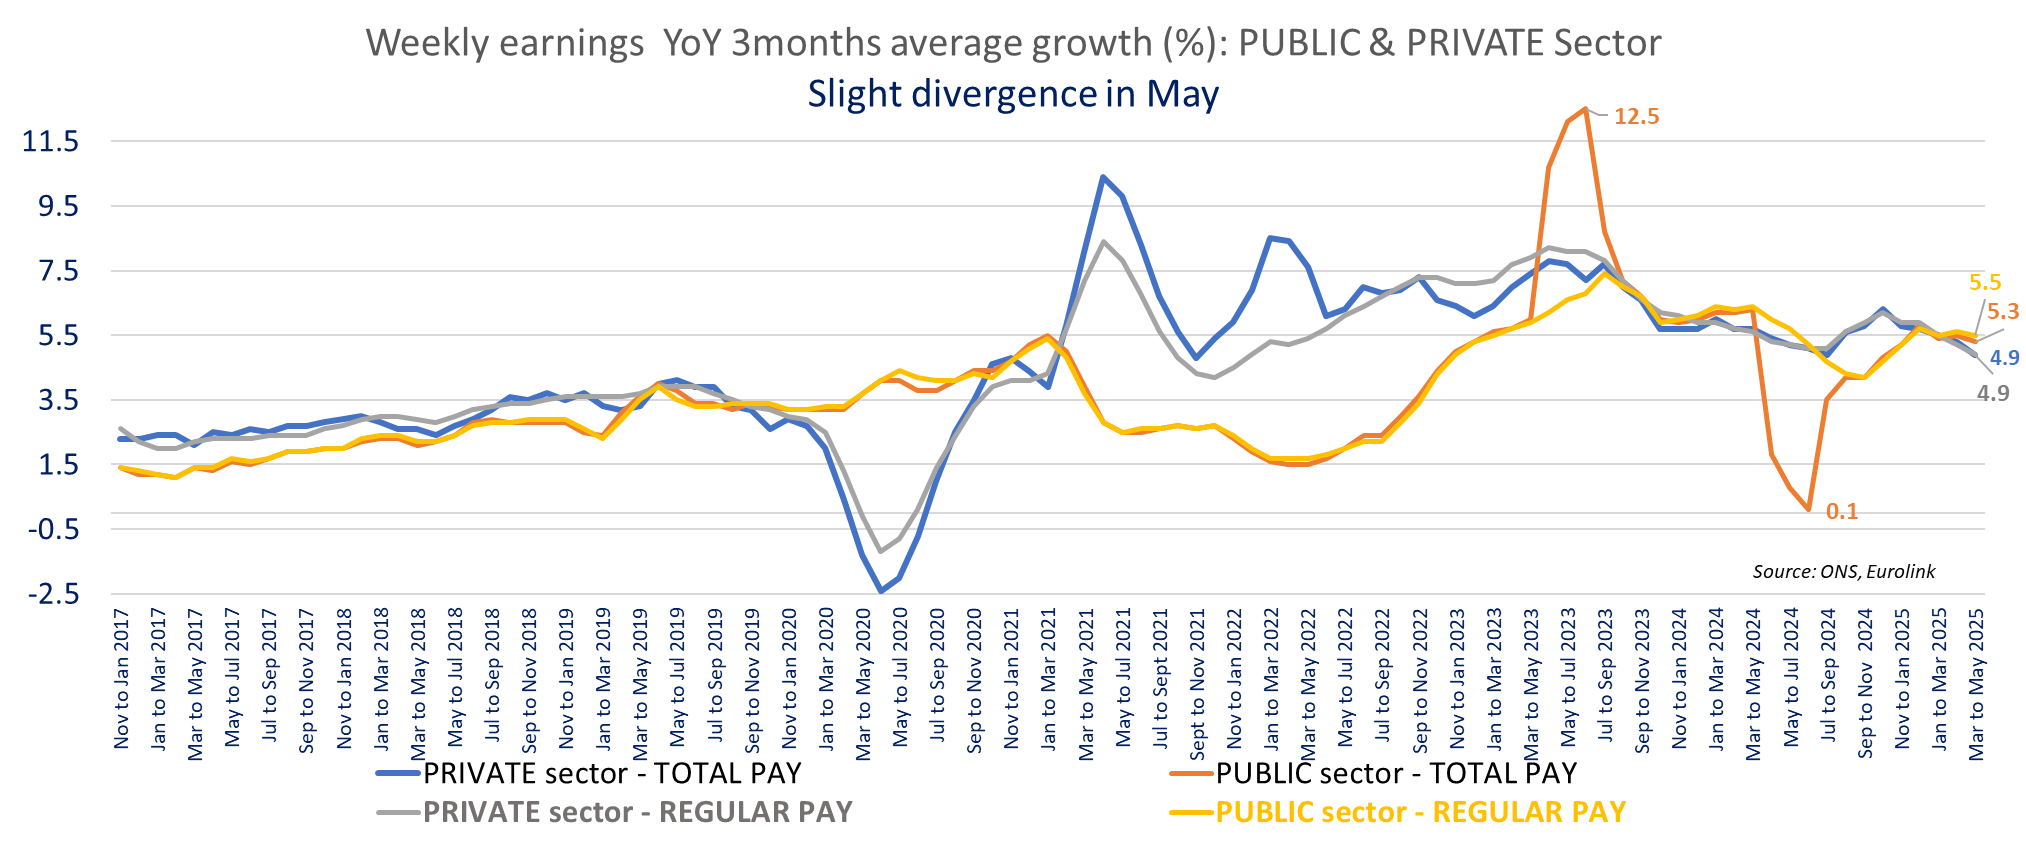
Weekly earnings’ growth slowed, to 5% yoy for the whole economy total pay (to £722/ week) in the 3 months ending in May, down from 5.4% yoy in April (revised up from 5.3% yoy), in line with expectations. Regular Pay (ex-bonus) is also down to 5% from 5.4% in April (revised up from 5.2%) the lowest growth rate in almost 3 years (June 2022)
Public sector wage growth held better with total pay up 5.3% yoy down from 5.5% and regular pay growth at 5.5% down from 5.6% in April (no revision).
The private sector wage growth is down to 4.9% yoy for both total Pay and regular pay down respectively from 5.3% in April (unrevised) and 5.2% in April (revised up from 5.1%). It is the slowest annual growth for private sector total pay since November 2021 (since January 2022 for regular pay).
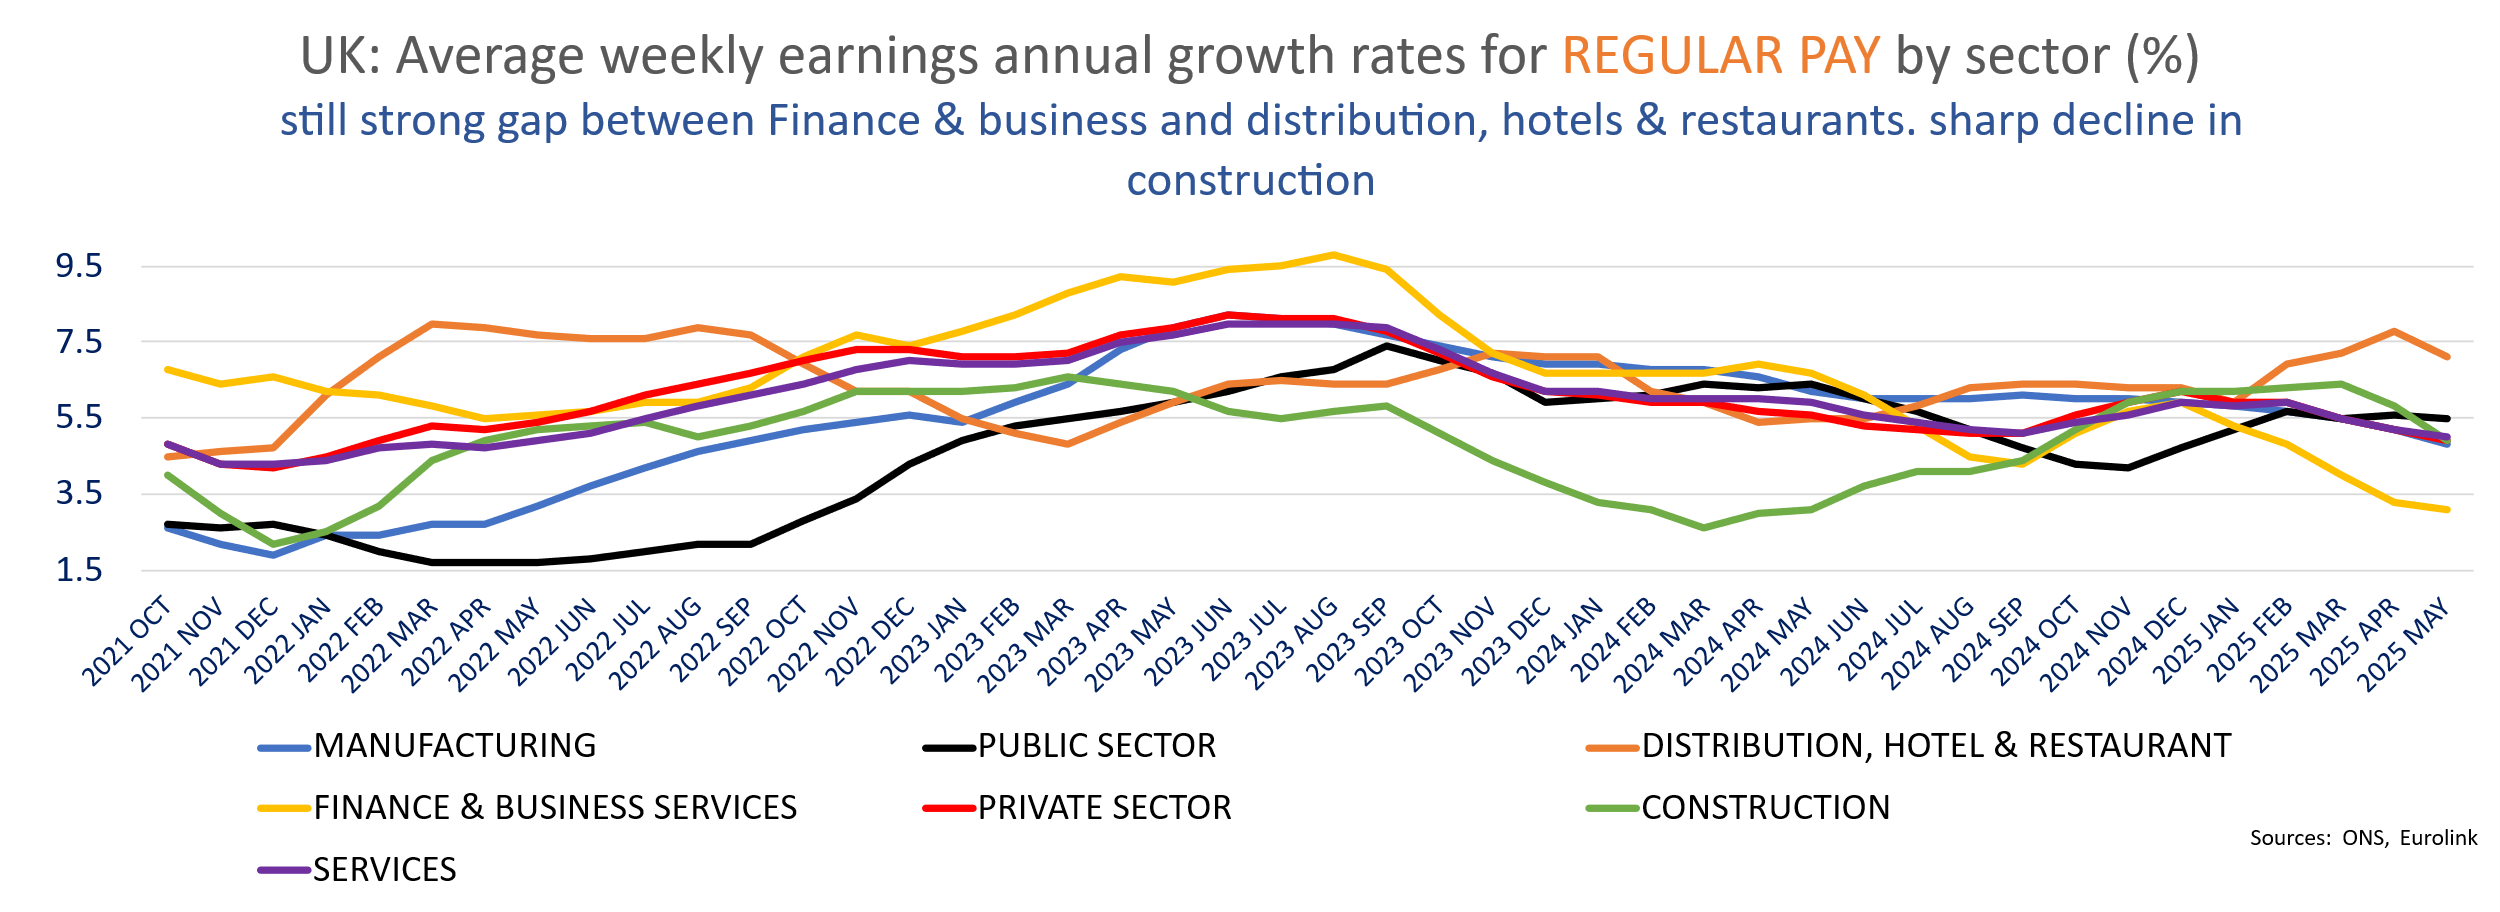
Within the private sector, manufacturing saw higher growth for total pay in May, up 4.5% yoy 3m/3m improving from 3.3% in April (big revision from 5.1% though). Manufacturing regular pay posts slower growth to 4.8% yoy from 5.2% in april (revised up from 5.1%).
Construction wage growth slowed to 6.5% total pay and 4.9% regular pay down from 7.6% and 5.8% respectively.
In services wage growth is down to 4.9% from 5.2% (revised from 5.1%) for total pay and to5% frp, 5.2% (unrevised) for Regular pay. Pay growth remains stronger for distribution hotels & restaurants (6.8% vs 7.7% for total pay and 7.1% vs 7.8% for regular pay) than for finance & business services for which total pay growth is the weakest since September 2020 at 3.4% yoy, down from 3.9% in April (revised from 3.8%) and regular pay increase by only 3.1% (below inflation), weakests since August 2020, down from 3.3% in April (revised from 3.2%).

Within the private sector, manufacturing saw higher growth for total pay in May, up 4.5% yoy 3m/3m improving from 3.3% in April (big revision from 5.1% though). Manufcturing regular pay posts slower growth to 4.8% yoy from 5.2% in april (revised up from 5.1%).
Construction wage growth slowed to 6.5% total pay and 4.9% regular pay down from 7.6% and 5.8% respectivel
In services wage growth is down to 4.9% from 5.2% (revised from 5.1%) for total pay and to5% frp, 5.2% (unrevised) for Regular pay. Pay growth remains strober for distribution hotels & restaurants (6.8% vs 7.7% for total pay and 7.1% vs 7.8% for regular pay) than for finance & business services for which total pay growth is the weakest since September 2020 at 3.4% yoy, down from 3.9% in April (revised from 3.8%) and regular pay increase by only 3.1% (below inflation), weakests since August 2020, down from 3.3% in April (revised from 3.2%).
|
|
Thursday, July 17, 2025 | ||
|
AAK |
AAK AB (publ) | ||
|
SEK |
264.20 |
+9.26% | |
|
AAK |
AAK, a producer of plant-based specialty ingredients, posted higher-than-expected revenue for the second quarter, while its operating profit also surpassed forecasts despite a year-on-year decline. | ||
|
|
|
|
|
|
ABBN | |||
|
CHF |
51.22 |
+8.04% | |
|
ABBN |
ABB Ltd reported strong order growth (+14%) in Q2 driven by a large Automation ($600m) order and continued strengh in Electrification orders (+9%). In the robotics-related segments, ABB saw delays in investment decisions by customers due to tariff-related uncertainty. Orders declined in most customer | ||
|
|
|
|
|
|
LR | |||
|
EUR |
119.90 |
+7.49% | |
|
LR |
Legrand pre-released strong H1 sales largely fueled by continued strong growth in datacenter activity. Organic growth in sales was +9.0% for the period, including +10.1% in the second quarter. This was again mostly driven by North america (+22% Q2, +20.5% Q1). 2025 full-year sales target revised upward: Taking into account the sales of the first six months of the year and considering the world’s current macroeconomic outlook as well as a gradual normalization of customs policies, Legrand is now targeting full-year 2025 sales growth (organic and through acquisitions, excluding currency effects) of between +10% and +12% (compared to +6% to +10% previously). This includes expected organic growth of +5% to +7% and growth from acquisitions of approximately +5%. | ||
|
|
|
|
|
|
EVO | |||
|
SEK |
823.40 |
+7.10% | |
|
EVO |
Live casino developer Evolution reported second-quarter revenue in line with expectations, while EBITDA profit exceeded forecasts. | ||
|
|
|
|
|
|
DPLM |
DIPLOMA PLC | ||
|
GBp |
5245.00 |
+6.95% | |
|
DPLM |
Diploma PLC issues a trading update for the nine months ending 30 June 2025. | ||
|
|
|
|
|
|
VOLCAR B |
Volvo Car AB | ||
|
SEK |
18.98 |
+6.81% | |
|
VOLCAR B |
Volvo Cars has reported a decline in revenue and swung to a loss in the second quarter. The adjusted EBIT margin was slightly better than in Q1. | ||
|
|
|
|
|
|
TEL2 A | |||
|
SEK |
145.00 |
+6.23% | |
|
TEL2 A |
Tele2 reported second-quarter revenues in line with expectations, while underlying EBITDA driven by cost controls exceeded forecasts by nearly 6%. The company also announced an upward revision of its full-year guidance. | ||
|
|
|
|
|
|
ASSA B | |||
|
SEK |
319.20 |
+5.73% | |
|
ASSA B |
Q2 Revenue edged up 0.1 percent to SEK 38,015 million (Consensus 37,721m). Organic sales growth reached 3 percent, up from -1 percent a year ago. Currency effects negatively impacted revenue by 8 percent. | ||
|
|
|
|
|
|
SFSN |
SFS Group Ltd | ||
|
CHF |
113.60 |
+4.60% | |
|
SFSN |
SFS generated sales of CHF 1,539.1 million in the first half of 2025. This corresponds to a year-over-year reduction of –0.4%. Currency effects slowed sales growth down by –2.3%. Organic growth of 1.1% was generated on a like-for-like basis. Our customers are largely taking a wait-and-see approach, postponing investment decisions, avoiding risks and focusing intensely on reducing their operating costs. The fact that the SFS Group achieved solid results in this market environment in the first half of the year is evidence of its good long-term positioning. Profitability was influenced by mix effects, some reductions in capacity utilization and non-recurring effects from changes made to the production and distribution network. All in all, SFS generated operating profit (EBIT) of CHF 162.2 million. The EBIT margin amounts to 10.6% of net sales. Excluding non-recurring effects, the SFS Group achieved an adjusted operating profit (EBIT) of 168.1 million and an adjusted EBIT margin of 11.0%. Program launched to increase profitability: The review of the current network and implementation of targeted adjustments should be completed by the end of 2027. SFS expects the program to reduce sales by a total of around CHF 110 million and for it to result in project-specific non-recurring costs of about CHF 75 million. The program’s successful implementation will enable the SFS Group to increase its profitability and improve its EBIT margin by approximately 0.8 percentage points. Non-recurring costs will be reported separately for the duration of the changes and EBIT will be adjusted. | ||
|
|
|
|
|
|
QQ. |
QINETIQ GROUP PLC | ||
|
GBp |
499.60 |
+2.97% | |
|
QQ. |
Q1 trading update. The financial year has started as anticipated, having taken a prudent view on the recovery of short-cycle order flow and beginning the year with good revenue cover of 75%. We are on-track with our cost efficiency program, the benefits of which will come through in the second half. Consistent with our full-year expectations we anticipate c.46-48% of revenue in the first half at c.10% margin and good cashflow. Our expectations for the full year remain unchanged with c.3% organic revenue growth, margin of c.11%, EPS growth in the range of 15-20% and good cash conversion. | ||
|
|
|
|
|
|
DG |
Vinci SA | ||
|
EUR |
124.55 |
+1.51% | |
|
DG |
VINCI, the French construction and concessions giant, announced the acquisition of Wärtsilä SAM Electronics GmbH, strengthening VINCI Energies’ position in the defense and marine technology sectors. This marks a notable expansion into high-value, technology-driven markets, broadening VINCI’s industrial footprint and geographic reach, especially in Germany. The acquired firm brings €100 million in annual revenue and 350 skilled employees, signaling VINCI’s continued appetite for growth via targeted acquisitions | ||
|
|
|
|
|
|
|
|
|
|
|
SSE |
SSE PLC | ||
|
GBp |
1847.50 |
+0.19% | |
|
SSE |
Full-year outlook reaffirmed: SSE maintained its guidance for fiscal 2027, expecting adjusted earnings per share between 175p and 200p, following 160p for 2025. | ||
|
|
|
|
|
|
R3NK |
RENT GROUP | ||
|
EUR |
71.52 |
+0.13% | |
|
R3NK |
Group revenue and adjusted EBIT for Q2 and the first half of 2025 held steady compared to 2024, with both above the company’s historical 15% CAGR target. The Vehicle Mobility Solutions (VMS) segment remains the primary growth engine, contributing the most to order intake, revenue, and EBIT, and delivering margins ahead of last year’s levels due to improved efficiency. | ||
|
|
|
|
|
|
|
|
|
|
|
NOVN |
Novartis Inc. | ||
|
CHF |
93.23 |
-1.99% | |
|
NOVN |
Q2 Net sales climbed 12% year-over-year to $14.1 billion, outpacing expectations and driven by strong performances in growth drivers like Kisqali (+64%), Kesimpta (+33%), and Entresto (+22%). Core operating income jumped 21% to $5.9 billion, with a margin expanding to 42.2%a 340 basis point improvement year-on-year. Earnings per share reached $2.42, ahead of analyst forecasts, while free cash flow surged 37% to $6.3 billion. | ||
|
|
|
|
|
|
VOLV B | |||
|
SEK |
263.60 |
-2.12% | |
|
VOLV B |
Volvo AB reported net sales of SEK 122.9 bn—a 5% decline on a currency-adjusted basis—driven by a 6% drop in vehicle volumes, particularly in North America where trade uncertainties linger Europe showed signs of stabilization, cushioning the overall decline. | ||
|
|
|
|
|
|
|
|
|
|
|
EQT |
EQT AB | ||
|
SEK |
328.60 |
-3.01% | |
|
EQT |
Revenue and Profit: EQT posted a 3% increase in H1 revenue to €1.27 billion and net profit of €346 million, both softer than consensus expectations. However, adjusted EBITDA jumped 32% to €806 million, beating forecasts and driving a healthy 60% margin. | ||
|
|
|
|
|
|
NDA FI |
Nordea Bank Abp | ||
|
EUR |
12.03 |
-3.64% | |
|
NDA FI |
Q2 Operating profit reached EUR 1.6 billion, narrowly surpassing market expectations. Total income was resilient, but net interest income declined by 6% year-on-year due to policy rate cuts in the quarter, consistent with broader sector trends. Fee and commission income stabilized after early-quarter market volatility, while insurance and fair value contributions remained solid. | ||
|
|
|
|
|
|
ESSITY B | |||
|
SEK |
248.00 |
-4.32% |
Essity AB (publ) release |
|
ESSITY B |
Q2 adjusted EBITA came in 5% below expectations due to lower volumes, particularly in the institutional incontinence market and the U.S. professional hygiene segment. | ||
|
|
|
|
|
|
PUB | |||
|
EUR |
85.06 |
-5.36% | |
|
PUB |
Q2 organic net revenue surged +5.9% year-over-year—comfortably beating the 4.6% consensus and surpassing its own five-year CAGR of \~4.9%. Full‑year organic growth forecast was raised to “close to 5%,” up from the prior 4–5% range. Total Q2 revenue rose 10% to €3.62 billion, with organic growth fueled by a “record new business run” including Coca‑Cola, Nespresso, Lego, Paramount, and Spotify; net new business wins hit $5.2 billion in H1. Growth was geographically broad across North America (+5.3%), Europe (+4.6%), and Asia‑Pac (+5.7%). | ||
|
|
|
|
|
|
DKSH | |||
|
CHF |
60.20 |
-5.79% | |
|
DKSH |
H1 Organic sales growth was 1.8% year-on-year, underperforming the consensus estimate of 2.7%. | ||
|
|
|
|
|
|
WISE | |||
|
GBp |
1038.00 |
-8.30% | |
|
WISE |
Wise Q1 cross-border volume grew +24% YoY (+27% YoY on a constant currency basis) slightly below consensus, to £41.2bn, and Wise customer holdings grew by 31% to £22.9bn. 9.8m active customers used Wise in Q1, representing active customer growth of 17% YoY. Cross-border take rate reduced by 1bp in the quarter, or 12 bps in the year to 30 June 2025, to 52bps, reflecting a reduction in the average price together with a continued increase in the proportion of higher volume customers in the period. Underlying income was £362.0m in Q1 FY26, up 11% YoY on a reported basis and 14% YoY on a constant currency basis. Wise continues to expect strong growth in underlying income in FY26, in line with the medium-term guidance of 15-20% on a constant currency basis. Remains focused on the long-term growth opportunity and becoming ‘theʼ network for the worldʼs money while investing to target an underlying profit before tax margin of 13-16% in the medium term, with FY26 expected to be around the top of this range. | ||

Versus early hours

SECTOR PERFORMANCE
Versus early hours:

Indices

Versus early hours


DISCLAIMER
This material is provided by Eurolink Securities L.L.C. for information purposes only and is not intended as a recommendation or an offer or solicitation for the purchase or sale of any security or financial instrument. The opinions, forecasts, facts, and recommendations contained here are based upon the information available as of the date of the report. The analysts are basing their opinions upon information they have received from sources they believe to be accurate and reliable. The report is directed exclusively at Institutional Investors who make their own decisions regardless of the present publication or opinions reflected within the report. This material is not a complete analysis of all material facts respecting any issuer, industry, or security or of your investment objectives, parameters, needs or financial situation, and therefore is not a sufficient basis alone on which to base an investment decision. A guarantee of completeness and accuracy of the information in this report is not assumed by Eurolink Securities LLC and any liability arising from the use of this report is excluded and disclaimed. The information contained herein is as of the date and time referenced above. Opinions and recommendations are subject to change without notice. Eurolink Securities L.L.C. has any obligation to update such information. Past performance is not indicative of future results. The investments discussed may fluctuate in price or value. Changes in rates of exchange may have an adverse effect on the value of investments. Transactions involving the financial instruments mentioned herein may not be suitable for all investors. Eurolink Securities L.L.C. has no obligation to continue to provide this research product and no such obligation is implied or guaranteed. The distribution rights of this report belong solely to Eurolink Securities L.L.C. It is prohibited to publish or to give this report or parts to third parties. No parts of it may be reproduced, resold, stored, or transmitted in any printed, electronic, or other form, or used for generating or marketing any printed or electronic publication, service, or product without Eurolink Securities LLC’s previous approval.